Berkshire Hathaway 2014 Annual Report Download - page 95
Download and view the complete annual report
Please find page 95 of the 2014 Berkshire Hathaway annual report below. You can navigate through the pages in the report by either clicking on the pages listed below, or by using the keyword search tool below to find specific information within the annual report.-
 1
1 -
2
-
3
-
4
-
5
-
6
-
7
-
8
-
9
-
10
-
11
-
12
-
13
-
14
-
15
-
16
-
17
-
18
-
19
-
20
-
21
-
22
-
23
-
24
-
25
-
26
-
27
-
28
-
29
-
30
-
31
-
32
-
33
-
34
-
35
-
36
-
37
-
38
-
39
-
40
-
41
-
42
-
43
-
44
-
45
-
46
-
47
-
48
-
49
-
50
-
51
-
52
-
53
-
54
-
55
-
56
-
57
-
58
-
59
-
60
-
61
-
62
-
63
-
64
-
65
-
66
-
67
-
68
-
69
-
70
-
71
-
72
-
73
-
74
-
75
-
76
-
77
-
78
-
79
-
80
-
81
-
82
-
83
-
84
-
 85
85 -
 86
86 -
 87
87 -
 88
88 -
 89
89 -
 90
90 -
 91
91 -
 92
92 -
 93
93 -
 94
94 -
 95
95 -
 96
96 -
 97
97 -
 98
98 -
 99
99 -
 100
100 -
 101
101 -
 102
102 -
 103
103 -
 104
104 -
 105
105 -
106
-
107
-
108
-
109
-
110
-
111
-
112
-
113
-
114
-
115
-
116
-
117
-
118
-
119
-
120
-
121
-
122
-
123
-
124
-
125
-
126
-
127
-
128
-
129
-
130
-
131
-
132
-
133
-
134
-
135
-
136
-
137
-
138
-
139
-
140
-
141
-
142
-
143
-
144
-
145
-
146
-
147
-
148
 |
 |

Management’s Discussion (Continued)
Insurance—Investment Income (Continued)
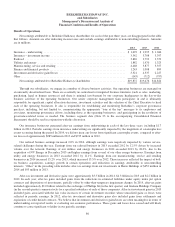
Investment income consists of interest and dividends earned on investments held by our insurance businesses. Pre-tax
investment income in 2014 was $4,357 million, representing a decline of $356 million (8%) versus 2013. The decline was
attributable to lower interest income from fixed maturity securities, partially offset by increased dividend income from equity
securities. The reduction in interest income reflected the maturities and dispositions during the last two years of several fixed
maturity securities with higher interest rates, including $4.4 billion par amount of Wrigley 11.45% subordinated notes as a result
of the repurchase of those notes by the issuer in 2013. Our insurance businesses continue to hold significant cash and cash
equivalent balances (approximately $42.8 billion as of December 31, 2014) earning very low yields. We believe that
maintaining ample liquidity is paramount and we insist on safety over yield with respect to cash and cash equivalents. The
increase in dividends earned reflected higher dividend rates for certain of our equity holdings. Beginning in 2015, investment
income will include dividends from our investment in Restaurant Brands International, Inc. Preferred Stock ($3 billion stated
value).
Pre-tax investment income in 2013 increased $259 million (5.8%) compared to 2012. The increase was primarily
attributable to increased dividend income on equity investments, which reflected increased dividend rates for certain of our
larger equity holdings as well as increased overall investments in equity securities.
Invested assets derive from shareholder capital and reinvested earnings as well as net liabilities under insurance contracts
or “float.” The major components of float are unpaid losses, life, annuity and health benefit liabilities, unearned premiums and
other liabilities to policyholders less premium and reinsurance receivables, deferred charges assumed under retroactive
reinsurance contracts and deferred policy acquisition costs. Float approximated $84 billion at December 31, 2014, $77 billion at
December 31, 2013, and $73 billion at December 31, 2012. The cost of float was negative over the last three years as our
insurance business generated pre-tax underwriting gains in each year.
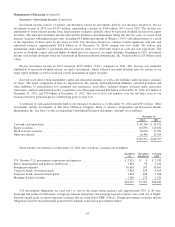
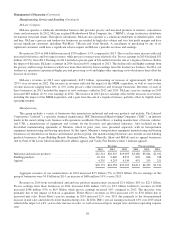
A summary of cash and investments held in our insurance businesses as of December 31, 2014 and 2013 follows. Other
investments include investments in The Dow Chemical Company, Bank of America Corporation and Restaurant Brands
International, Inc. See Note 5 to the accompanying Consolidated Financial Statements. Amounts are in millions.
December 31,
2014 2013
Cash and cash equivalents ............................................................... $ 42,760 $ 32,572
Equity securities ...................................................................... 114,876 114,832
Fixed maturity securities ................................................................ 26,010 27,059
Other investments ..................................................................... 16,346 12,334
$199,992 $186,797
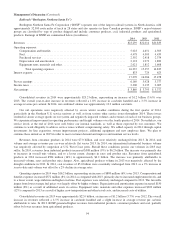
Fixed maturity investments as of December 31, 2014 were as follows. Amounts are in millions.
Amortized
cost
Unrealized
gains/losses
Carrying
value
U.S. Treasury, U.S. government corporations and agencies ............................ $ 2,921 $ 9 $ 2,930
States, municipalities and political subdivisions ..................................... 1,820 92 1,912
Foreign governments .......................................................... 10,620 247 10,867
Corporate bonds, investment grade ............................................... 5,826 639 6,465
Corporate bonds, non-investment grade ........................................... 1,878 428 2,306
Mortgage-backed securities ..................................................... 1,360 170 1,530
$24,425 $1,585 $26,010
U.S. government obligations are rated AA+ or Aaa by the major rating agencies and approximately 87% of all state,
municipal and political subdivisions, foreign government obligations and mortgage-backed securities were rated AA or higher.
Non-investment grade securities represent securities that are rated below BBB- or Baa3. Foreign government securities include
obligations issued or unconditionally guaranteed by national or provincial government entities.
93