Berkshire Hathaway 2014 Annual Report Download - page 94
Download and view the complete annual report
Please find page 94 of the 2014 Berkshire Hathaway annual report below. You can navigate through the pages in the report by either clicking on the pages listed below, or by using the keyword search tool below to find specific information within the annual report.-
 1
1 -
2
-
3
-
4
-
5
-
6
-
7
-
8
-
9
-
10
-
11
-
12
-
13
-
14
-
15
-
16
-
17
-
18
-
19
-
20
-
21
-
22
-
23
-
24
-
25
-
26
-
27
-
28
-
29
-
30
-
31
-
32
-
33
-
34
-
35
-
36
-
37
-
38
-
39
-
40
-
41
-
42
-
43
-
44
-
45
-
46
-
47
-
48
-
49
-
50
-
51
-
52
-
53
-
54
-
55
-
56
-
57
-
58
-
59
-
60
-
61
-
62
-
63
-
64
-
65
-
66
-
67
-
68
-
69
-
70
-
71
-
72
-
73
-
74
-
75
-
76
-
77
-
78
-
79
-
80
-
81
-
82
-
83
-
 84
84 -
 85
85 -
 86
86 -
 87
87 -
 88
88 -
 89
89 -
 90
90 -
 91
91 -
 92
92 -
 93
93 -
 94
94 -
 95
95 -
 96
96 -
 97
97 -
 98
98 -
 99
99 -
 100
100 -
 101
101 -
 102
102 -
 103
103 -
 104
104 -
105
-
106
-
107
-
108
-
109
-
110
-
111
-
112
-
113
-
114
-
115
-
116
-
117
-
118
-
119
-
120
-
121
-
122
-
123
-
124
-
125
-
126
-
127
-
128
-
129
-
130
-
131
-
132
-
133
-
134
-
135
-
136
-
137
-
138
-
139
-
140
-
141
-
142
-
143
-
144
-
145
-
146
-
147
-
148
 |
 |

Management’s Discussion (Continued)
Insurance—Underwriting (Continued)
Berkshire Hathaway Reinsurance Group (Continued)
Life and annuity (Continued)
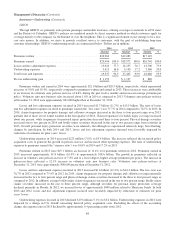
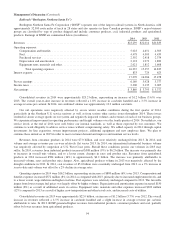
Life and annuity premiums earned in 2013 increased $476 million (17%) over premiums earned in 2012. The increase in
2013 was primarily attributable to the aforementioned new variable annuity guarantee reinsurance contract and the reversal of
premiums under the SRLHA contract as a result of the contract amendment. Premiums earned in 2013 and 2012 also included
$1.4 billion and $794 million, respectively, from traditional annuity insurance and reinsurance contracts.
The life and annuity business produced a pre-tax loss of $173 million in 2014, a pre-tax gain of $379 million in 2013 and a
pre-tax loss in 2012 of $190 million. Before foreign currency exchange rate gains and losses, this business generated a pre-tax
loss of $275 million in 2014, a pre-tax gain of $442 million in 2013 and a pre-tax loss of $174 million in 2012.
Structured settlement and traditional annuity contracts generated underwriting losses of $299 million in 2014, $151 million
in 2013, and $143 million in 2012 before foreign currency effects. Generally, all of the premiums under these contracts are
received at inception and payments are made over time, often extending for decades. These underwriting losses were primarily
attributable to the recurring impact of the accretion of discounted annuity liabilities. Aggregate annuity liabilities were
approximately $7.1 billion at December 31, 2014, $5.7 billion at December 31, 2013 and $3.8 billion at December 31, 2012.
The life and annuity business also included pre-tax gains of $47 million in 2014 and $256 million in 2013 from variable
annuity guarantee contracts. The gains were primarily attributable to the impact of rising equity markets which lowered
estimates of liabilities for guaranteed minimum benefits. Periodic results from these contracts can be volatile reflecting changes
in returns in investment markets, which impact the underlying insured exposures. In 2013, life and annuity underwriting results
included a one-time pre-tax gain of $255 million related to the aforementioned amendment to the SRLHA reinsurance contract.
This one-time gain occurred as the reversal of premiums earned was more than offset by the reversal of life benefits incurred.
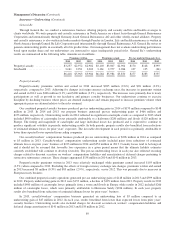
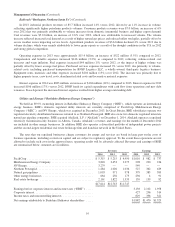
Berkshire Hathaway Primary Group
The Berkshire Hathaway Primary Group (“BH Primary”) consists of a wide variety of independently managed insurance
businesses. These businesses include: Medical Protective Company and Princeton Insurance Company, providers of healthcare
malpractice insurance coverages; National Indemnity Company’s primary group (“NICO Primary”), writers of commercial
motor vehicle and general liability coverages; U.S. Investment Corporation, whose subsidiaries underwrite specialty insurance
coverages; a group of companies referred to as Berkshire Hathaway Homestate Companies (“BHHC”), providers of commercial
multi-line insurance, including workers’ compensation; Central States Indemnity Company, a provider of credit and Medicare
Supplement insurance; Applied Underwriters, a provider of integrated workers’ compensation solutions; BoatU.S., a writer of
insurance for owners of boats and small watercraft; and Berkshire Hathaway Guard Insurance Companies (“Guard”), providers
of workers’ compensation and commercial property and casualty insurance coverage to small and mid-sized businesses. In the
second quarter of 2013, we formed Berkshire Hathaway Specialty Insurance (“BH Specialty”), which concentrates on providing
large scale insurance solutions for commercial property and casualty risks.
Premiums earned in 2014 and 2013 aggregated $4.4 billion and $3.3 billion, respectively. The increase in premiums was
primarily attributable to volume increases from BH Specialty, NICO Primary, BHHC and Guard. Premiums earned in 2013 by
BH Primary increased $1,079 million (48%) over 2012. The comparative increase in 2013 reflected the impact of the Guard
acquisition in 2012. In addition, BHHC’s premiums earned increased $301 million in 2013 as compared to 2012, due primarily
to significantly higher workers’ compensation insurance volume. The BH Primary insurers produced aggregate pre-tax
underwriting gains of $626 million in 2014, $385 million in 2013 and $286 million in 2012. Combined loss ratios were 60% in
2014 and in 2013 and 58% in 2012. Overall, the claim environment over the past three years has been favorable. However, these
primary insurers write sizable amounts of liability and workers’ compensation business, which can have extended claim tails. It
should not be assumed that the current claim experience or underwriting results will continue into the future.
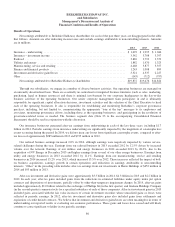
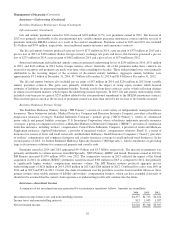
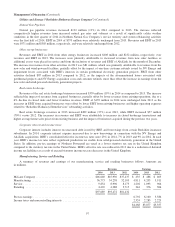
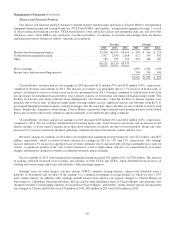
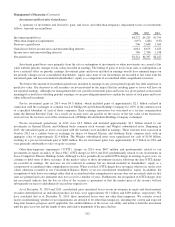
Insurance—Investment Income
A summary of net investment income generated by our insurance operations follows. Amounts are in millions.
2014 2013 2012
Investment income before taxes and noncontrolling interests ................................ $4,357 $4,713 $4,454
Income taxes and noncontrolling interests ............................................... 815 1,005 1,057
Net investment income .............................................................. $3,542 $3,708 $3,397
92