Berkshire Hathaway 2014 Annual Report Download - page 96
Download and view the complete annual report
Please find page 96 of the 2014 Berkshire Hathaway annual report below. You can navigate through the pages in the report by either clicking on the pages listed below, or by using the keyword search tool below to find specific information within the annual report.-
 1
1 -
2
-
3
-
4
-
5
-
6
-
7
-
8
-
9
-
10
-
11
-
12
-
13
-
14
-
15
-
16
-
17
-
18
-
19
-
20
-
21
-
22
-
23
-
24
-
25
-
26
-
27
-
28
-
29
-
30
-
31
-
32
-
33
-
34
-
35
-
36
-
37
-
38
-
39
-
40
-
41
-
42
-
43
-
44
-
45
-
46
-
47
-
48
-
49
-
50
-
51
-
52
-
53
-
54
-
55
-
56
-
57
-
58
-
59
-
60
-
61
-
62
-
63
-
64
-
65
-
66
-
67
-
68
-
69
-
70
-
71
-
72
-
73
-
74
-
75
-
76
-
77
-
78
-
79
-
80
-
81
-
82
-
83
-
84
-
85
-
 86
86 -
 87
87 -
 88
88 -
 89
89 -
 90
90 -
 91
91 -
 92
92 -
 93
93 -
 94
94 -
 95
95 -
 96
96 -
 97
97 -
 98
98 -
 99
99 -
 100
100 -
 101
101 -
 102
102 -
 103
103 -
 104
104 -
 105
105 -
 106
106 -
107
-
108
-
109
-
110
-
111
-
112
-
113
-
114
-
115
-
116
-
117
-
118
-
119
-
120
-
121
-
122
-
123
-
124
-
125
-
126
-
127
-
128
-
129
-
130
-
131
-
132
-
133
-
134
-
135
-
136
-
137
-
138
-
139
-
140
-
141
-
142
-
143
-
144
-
145
-
146
-
147
-
148
 |
 |

Management’s Discussion (Continued)
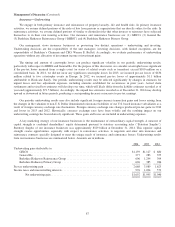
Railroad (“Burlington Northern Santa Fe”)
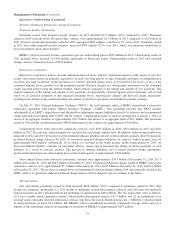
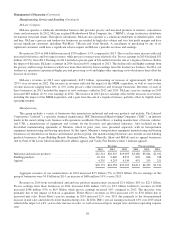
Burlington Northern Santa Fe Corporation (“BNSF”) operates one of the largest railroad systems in North America with
approximately 32,500 route miles of track in 28 states and also operates in three Canadian provinces. BNSF’s major business
groups are classified by type of product shipped and include consumer products, coal, industrial products and agricultural
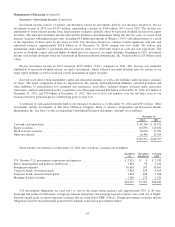
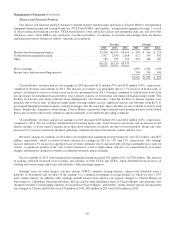
products. Earnings of BNSF are summarized below (in millions).
2014 2013 2012
Revenues ..................................................................... $23,239 $22,014 $20,835
Operating expenses:
Compensation and benefits ................................................... 5,023 4,651 4,505
Fuel ...................................................................... 4,478 4,503 4,459
Purchased services .......................................................... 2,592 2,418 2,374
Depreciation and amortization ................................................. 2,123 1,973 1,889
Equipment rents, materials and other ............................................ 2,021 1,812 1,608
Total operating expenses ................................................. 16,237 15,357 14,835
Interest expense ................................................................ 833 729 623
17,070 16,086 15,458
Pre-tax earnings ................................................................ 6,169 5,928 5,377
Income taxes ................................................................... 2,300 2,135 2,005
Net earnings ................................................................... $ 3,869 $ 3,793 $ 3,372
Consolidated revenues in 2014 were approximately $23.2 billion, representing an increase of $1.2 billion (5.6%) over
2013. The overall year-to-date increase in revenues reflected a 1.8% increase in cars/units handled and a 3.5% increase in
average revenue per car/unit. In 2014, our combined volume was approximately 10.3 million cars/units.
Our rail operations were negatively affected by severe winter weather conditions during the first quarter of 2014,
particularly in the Northern U.S. service territory as well as from various other service issues throughout 2014. These issues
resulted in slower average speeds on our system and negatively impacted volumes and revenues of each of our business groups.
We experienced improvement in operating performance and freight volumes over the fourth quarter of 2014. Nevertheless, our
service levels at the end of 2014 were well below our internal standards, as well as those expected by our customers. We
continue to work diligently to address service issues without compromising safety. We added capacity in 2014 through capital
investments for line expansion, system improvement projects, additional equipment and new employee hires. We plan to
continue these initiatives in 2015 in order to meet customer demand and improve and maintain service levels.
Revenues from consumer products in 2014 were $7.0 billion, and were relatively unchanged from 2013. In 2014, unit
volume and average revenues per car were relatively flat versus 2013. In 2014, our international intermodal business volume
was negatively affected by congestion at U.S. West Coast ports. Should these conditions persist, our volumes in 2015 may
suffer. In 2014, revenues from industrial products increased $508 million (9%) to $6.2 billion. The increase was primarily due
to increases in overall unit volume, and to a lesser extent, changes in rates and product mix. Revenues from agricultural
products in 2014 increased $584 million (16%) to approximately $4.2 billion. The increase was primarily attributable to
increased volume, rates and product mix changes. Also, agricultural products volume in 2013 was negatively affected by the
drought conditions in 2012. In 2014, coal revenues of $5.0 billion were essentially unchanged from 2013, as a 2% increase in
year-to-date unit volume was offset by a 2% decline in average rates.
Operating expenses in 2014 were $16.2 billion, representing an increase of $880 million (6%) over 2013. Compensation and
benefits expenses increased $372 million (8%) in 2014 as compared with 2013, primarily due to increased employment levels, and
to a lesser extent, wage inflation and higher overtime. Fuel expenses were relatively unchanged compared to 2013. The favorable
impact from lower average fuel prices was largely offset by higher volumes. Depreciation and amortization expense increased $150
million (8%) as a result of additional assets in service. Equipment rents, materials and other expenses increased $209 million
(12%) compared to 2013 as a result of higher crew transportation and other travel costs, and increased costs of utilities.
Consolidated revenues in 2013 were approximately $22.0 billion, an increase of $1.2 billion (5.7%) over 2012. The overall
increase in revenues reflected a 4.5% increase in cars/units handled and a slight increase in average revenue per car/unit,
attributable to rates. In 2013, BNSF generated higher revenues from industrial products, consumer products and coal, partially
offset by lower revenues from agricultural products.
94