Berkshire Hathaway 2014 Annual Report Download - page 15
Download and view the complete annual report
Please find page 15 of the 2014 Berkshire Hathaway annual report below. You can navigate through the pages in the report by either clicking on the pages listed below, or by using the keyword search tool below to find specific information within the annual report.-
 1
1 -
2
-
3
-
4
-
 5
5 -
 6
6 -
 7
7 -
 8
8 -
 9
9 -
 10
10 -
 11
11 -
 12
12 -
 13
13 -
 14
14 -
 15
15 -
 16
16 -
 17
17 -
 18
18 -
 19
19 -
 20
20 -
 21
21 -
 22
22 -
 23
23 -
 24
24 -
 25
25 -
26
-
27
-
28
-
29
-
30
-
31
-
32
-
33
-
34
-
35
-
36
-
37
-
38
-
39
-
40
-
41
-
42
-
43
-
44
-
45
-
46
-
47
-
48
-
49
-
50
-
51
-
52
-
53
-
54
-
55
-
56
-
57
-
58
-
59
-
60
-
61
-
62
-
63
-
64
-
65
-
66
-
67
-
68
-
69
-
70
-
71
-
72
-
73
-
74
-
75
-
76
-
77
-
78
-
79
-
80
-
81
-
82
-
83
-
84
-
85
-
86
-
87
-
88
-
89
-
90
-
91
-
92
-
93
-
94
-
95
-
96
-
97
-
98
-
99
-
100
-
101
-
102
-
103
-
104
-
105
-
106
-
107
-
108
-
109
-
110
-
111
-
112
-
113
-
114
-
115
-
116
-
117
-
118
-
119
-
120
-
121
-
122
-
123
-
124
-
125
-
126
-
127
-
128
-
129
-
130
-
131
-
132
-
133
-
134
-
135
-
136
-
137
-
138
-
139
-
140
-
141
-
142
-
143
-
144
-
145
-
146
-
147
-
148
 |
 |

Last year we fully met this objective at BHE, just as we have in every year of our ownership. Our rates
remain low, our customer satisfaction is high and our record for employee safety is among the best in the industry.
The story at BNSF, however – as I noted earlier – was not good in 2014, a year in which the railroad
disappointed many of its customers. This problem occurred despite the record capital expenditures that BNSF has
made in recent years, with those having far exceeded the outlays made by Union Pacific, our principal competitor.
The two railroads are of roughly equal size measured by revenues, though we carry considerably more
freight (measured either by carloads or ton-miles). But our service problems exceeded Union Pacific’s last year, and
we lost market share as a result. Moreover, U.P.’s earnings beat ours by a record amount. Clearly, we have a lot of
work to do.
We are wasting no time: As I also mentioned earlier, we will spend $6 billion in 2015 on improving our
railroad’s operation. That will amount to about 26% of estimated revenues (a calculation that serves as the
industry’s yardstick). Outlays of this magnitude are largely unheard of among railroads. For us, this percentage
compares to our average of 18% in 2009-2013 and to U.P.’s projection for the near future of 16-17%. Our huge
investments will soon lead to a system with greater capacity and much better service. Improved profits should
follow.
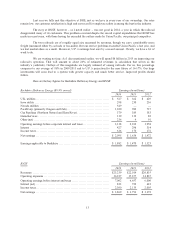
Here are the key figures for Berkshire Hathaway Energy and BNSF:
Berkshire Hathaway Energy (89.9% owned) Earnings (in millions)
2014 2013 2012
U.K. utilities ................................................................ $ 527 $ 362 $ 429
Iowa utility ................................................................. 298 230 236
Nevada utilities ............................................................. 549 — —
PacifiCorp (primarily Oregon and Utah) ..................................... 1,010 982 737
Gas Pipelines (Northern Natural and Kern River) ............................ 379 385 383
HomeServices .............................................................. 139 139 82
Other (net) .................................................................. 236 4 91
Operating earnings before corporate interest and taxes ....................... 3,138 2,102 1,958
Interest ..................................................................... 427 296 314
Income taxes ................................................................ 616 170 172
Net earnings ................................................................ $ 2,095 $ 1,636 $ 1,472
Earnings applicable to Berkshire ............................................ $ 1,882 $ 1,470 $ 1,323
BNSF Earnings (in millions)
2014 2013 2012
Revenues ................................................................... $23,239 $22,014 $20,835
Operating expenses ......................................................... 16,237 15,357 14,835
Operating earnings before interest and taxes ................................. 7,002 6,657 6,000
Interest (net) ................................................................ 833 729 623
Income taxes ................................................................ 2,300 2,135 2,005
Net earnings ................................................................ $ 3,869 $ 3,793 $ 3,372
13