Berkshire Hathaway 2014 Annual Report Download - page 86
Download and view the complete annual report
Please find page 86 of the 2014 Berkshire Hathaway annual report below. You can navigate through the pages in the report by either clicking on the pages listed below, or by using the keyword search tool below to find specific information within the annual report.-
 1
1 -
2
-
3
-
4
-
5
-
6
-
7
-
8
-
9
-
10
-
11
-
12
-
13
-
14
-
15
-
16
-
17
-
18
-
19
-
20
-
21
-
22
-
23
-
24
-
25
-
26
-
27
-
28
-
29
-
30
-
31
-
32
-
33
-
34
-
35
-
36
-
37
-
38
-
39
-
40
-
41
-
42
-
43
-
44
-
45
-
46
-
47
-
48
-
49
-
50
-
51
-
52
-
53
-
54
-
55
-
56
-
57
-
58
-
59
-
60
-
61
-
62
-
63
-
64
-
65
-
66
-
67
-
68
-
69
-
70
-
71
-
72
-
73
-
74
-
75
-
 76
76 -
 77
77 -
 78
78 -
 79
79 -
 80
80 -
 81
81 -
 82
82 -
 83
83 -
 84
84 -
 85
85 -
 86
86 -
 87
87 -
 88
88 -
 89
89 -
 90
90 -
 91
91 -
 92
92 -
 93
93 -
 94
94 -
 95
95 -
 96
96 -
97
-
98
-
99
-
100
-
101
-
102
-
103
-
104
-
105
-
106
-
107
-
108
-
109
-
110
-
111
-
112
-
113
-
114
-
115
-
116
-
117
-
118
-
119
-
120
-
121
-
122
-
123
-
124
-
125
-
126
-
127
-
128
-
129
-
130
-
131
-
132
-
133
-
134
-
135
-
136
-
137
-
138
-
139
-
140
-
141
-
142
-
143
-
144
-
145
-
146
-
147
-
148
 |
 |

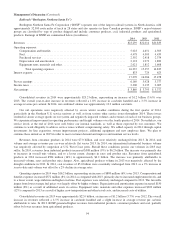
Notes to Consolidated Financial Statements (Continued)
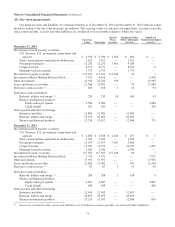
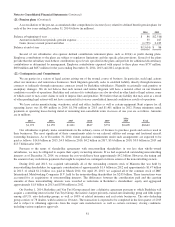
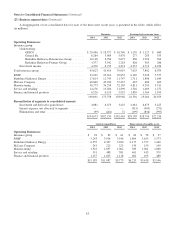
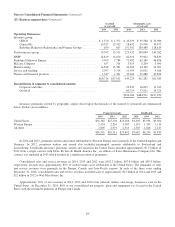
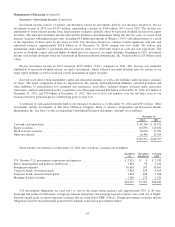
(23) Business segment data (Continued)
Goodwill
at year-end
Identifiable assets
at year-end
2014 2013 2014 2013 2012
Operating Businesses:
Insurance group:
GEICO ............................................... $ 1,370 $ 1,372 $ 45,439 $ 39,568 $ 30,986
General Re ............................................ 13,527 13,532 28,692 29,956 30,477
Berkshire Hathaway Reinsurance and Primary Groups .......... 650 607 151,301 138,480 118,819
Total insurance group ........................................ 15,547 15,511 225,432 208,004 180,282
BNSF .................................................... 14,819 14,819 62,916 59,842 56,839
Berkshire Hathaway Energy ................................... 9,599 7,784 71,482 62,189 46,856
McLane Company .......................................... 657 701 5,419 5,209 5,090
Manufacturing ............................................. 14,818 13,341 34,509 34,100 32,097
Service and retailing ......................................... 3,937 3,514 11,303 10,051 9,566
Finance and financial products ................................. 1,337 1,341 32,164 31,886 30,854
$60,714 $57,011 443,225 411,281 361,584
Reconciliation of segments to consolidated amount:
Corporate and other ..................................... 22,247 16,639 11,345
Goodwill .............................................. 60,714 57,011 54,523
$526,186 $484,931 $427,452
Insurance premiums written by geographic region (based upon the domicile of the insured or reinsured) are summarized
below. Dollars are in millions.
Property/Casualty Life/Health
2014 2013 2012 2014 2013 2012
United States ............................................ $31,362 $25,704 $23,186 $3,402 $3,934 $3,504
Western Europe .......................................... 2,424 2,234 4,387 1,135 1,339 1,114
All other ................................................ 2,805 2,973 2,319 1,305 1,026 1,217
$36,591 $30,911 $29,892 $5,842 $6,299 $5,835
In 2014 and 2013, premiums written and earned attributable to Western Europe were primarily in the United Kingdom and
Germany. In 2012, premiums written and earned also included meaningful amounts attributable to Switzerland and
Luxembourg. Life/health insurance premiums written and earned in the United States included approximately $1.5 billion in
2012 from a single contract with Swiss Re Life & Health America Inc., an affiliate of Swiss Reinsurance Company Ltd. This
contract was amended in 2013 which resulted in a significant return of premiums.
Consolidated sales and service revenues in 2014, 2013 and 2012 were $102.2 billion, $97.6 billion and $85.8 billion,
respectively. In each year, approximately 85% of such revenues were attributable to the United States. The remainder of sales
and service revenues were primarily in the Europe, Canada and Asia-Pacific regions. In each of the three years ending
December 31, 2014, consolidated sales and service revenues included sales of approximately $13 billion in 2014 and 2013 and
$12 billion in 2012 to Wal-Mart Stores, Inc.
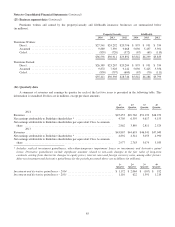
Approximately 96% of our revenues in 2014, 2013 and 2012 from railroad, utilities and energy businesses were in the
United States. At December 31, 2014, 88% of our consolidated net property, plant and equipment was located in the United
States with the remainder primarily in Europe and Canada.
84