Berkshire Hathaway 2014 Annual Report Download - page 97
Download and view the complete annual report
Please find page 97 of the 2014 Berkshire Hathaway annual report below. You can navigate through the pages in the report by either clicking on the pages listed below, or by using the keyword search tool below to find specific information within the annual report.-
 1
1 -
2
-
3
-
4
-
5
-
6
-
7
-
8
-
9
-
10
-
11
-
12
-
13
-
14
-
15
-
16
-
17
-
18
-
19
-
20
-
21
-
22
-
23
-
24
-
25
-
26
-
27
-
28
-
29
-
30
-
31
-
32
-
33
-
34
-
35
-
36
-
37
-
38
-
39
-
40
-
41
-
42
-
43
-
44
-
45
-
46
-
47
-
48
-
49
-
50
-
51
-
52
-
53
-
54
-
55
-
56
-
57
-
58
-
59
-
60
-
61
-
62
-
63
-
64
-
65
-
66
-
67
-
68
-
69
-
70
-
71
-
72
-
73
-
74
-
75
-
76
-
77
-
78
-
79
-
80
-
81
-
82
-
83
-
84
-
85
-
86
-
 87
87 -
 88
88 -
 89
89 -
 90
90 -
 91
91 -
 92
92 -
 93
93 -
 94
94 -
 95
95 -
 96
96 -
 97
97 -
 98
98 -
 99
99 -
 100
100 -
 101
101 -
 102
102 -
 103
103 -
 104
104 -
 105
105 -
 106
106 -
 107
107 -
108
-
109
-
110
-
111
-
112
-
113
-
114
-
115
-
116
-
117
-
118
-
119
-
120
-
121
-
122
-
123
-
124
-
125
-
126
-
127
-
128
-
129
-
130
-
131
-
132
-
133
-
134
-
135
-
136
-
137
-
138
-
139
-
140
-
141
-
142
-
143
-
144
-
145
-
146
-
147
-
148
 |
 |

Management’s Discussion (Continued)
Railroad (“Burlington Northern Santa Fe”) (Continued)
In 2013, industrial products revenues of $5.7 billion increased 14% versus 2012, driven by an 11% increase in volume,
reflecting significantly higher petroleum products volumes. Consumer products revenues were $7.0 billion, an increase of 6%
over 2012 that was primarily attributable to volume increases from domestic intermodal business and higher export demand.
Coal revenues were $5.0 billion, an increase of 2.6% over 2012, which was attributable to increased volume. The volume
increase reflected increased coal demand as a result of higher natural gas prices and reduced utility stockpiles, partially offset by
severe weather issues impacting service levels. Agricultural products revenues of $3.6 billion declined 4% versus 2012 due to
volume declines, which were mainly attributable to lower grain exports as a result of the drought conditions in the U.S. in 2012
and strong global competition.
Operating expenses in 2013 were approximately $15.4 billion, an increase of $522 million (3.5%) compared to 2012.
Compensation and benefits expenses increased $146 million (3.2%) as compared to 2012, reflecting volume-related cost
increases and wage inflation. Fuel expenses increased $44 million (1%) versus 2012, as the impact of higher volume was
partially offset by lower average fuel prices. Purchased services expenses increased 2% versus 2012, due primarily to volume-
related costs, including purchased transportation for BNSF Logistics LLC, a wholly-owned, third-party logistics business.
Equipment rents, materials and other expenses increased $204 million (13%) over 2012. The increase was primarily due to
higher property taxes, crew travel costs, derailment-related costs and locomotive material expenses.
Interest expense in 2014 was $833 million, an increase of $104 million (14%) compared to 2013. Interest expense in 2013
increased $106 million (17%) versus 2012. BNSF funds its capital expenditures with cash flow from operations and new debt
issuances. In each period, the increased interest expense resulted from higher average outstanding debt.
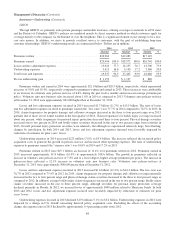
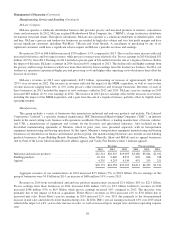
Utilities and Energy (“Berkshire Hathaway Energy Company”)
We hold an 89.9% ownership interest in Berkshire Hathaway Energy Company (“BHE”), which operates an international
energy business. BHE’s domestic regulated utility interests are currently comprised of PacifiCorp, MidAmerican Energy
Company (“MEC”), and NV Energy, which was acquired in December 2013. In Great Britain, BHE subsidiaries operate two
regulated electricity distribution businesses referred to as Northern Powergrid. BHE also owns two domestic regulated interstate
natural gas pipeline companies. BHE acquired AltaLink, L.P. (“AltaLink”) on December 1, 2014. AltaLink operates a regulated
electricity transmission-only business in Alberta, Canada. AltaLink’s revenues and earnings for the month of December 2014
are included in other energy businesses. In addition, BHE also operates a diversified portfolio of independent power projects
and the second-largest residential real estate brokerage firm and franchise network in the United States.
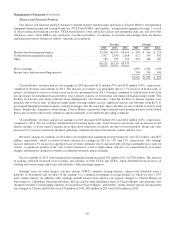
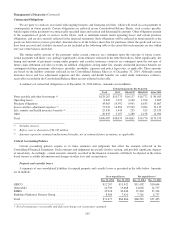
The rates that our regulated businesses charge customers for energy and services are based in large part on the costs of
business operations, including a return on capital, and are subject to regulatory approval. To the extent these operations are not
allowed to include such costs in the approved rates, operating results will be adversely affected. Revenues and earnings of BHE
are summarized below. Amounts are in millions.
Revenues Earnings
2014 2013 2012 2014 2013 2012
PacifiCorp .............................................. $ 5,315 $ 5,215 $ 4,950 $1,010 $ 982 $ 737
MidAmerican Energy Company ............................. 3,818 3,453 3,275 298 230 236
NV Energy .............................................. 3,279 — — 549 — —
Northern Powergrid ....................................... 1,284 1,026 1,036 527 362 429
Natural gas pipelines ...................................... 1,093 971 978 379 385 383
Other energy businesses ................................... 664 256 175 236 4 91
Real estate brokerage ..................................... 2,161 1,822 1,333 139 139 82
$17,614 $12,743 $11,747
Earnings before corporate interest and income taxes (“EBIT”) ..... 3,138 2,102 1,958
Corporate interest ........................................ 427 296 314
Income taxes and noncontrolling interests ..................... 829 336 321
Net earnings attributable to Berkshire Hathaway shareholders ..... $1,882 $1,470 $1,323
95