Berkshire Hathaway 2014 Annual Report Download - page 67
Download and view the complete annual report
Please find page 67 of the 2014 Berkshire Hathaway annual report below. You can navigate through the pages in the report by either clicking on the pages listed below, or by using the keyword search tool below to find specific information within the annual report.-
 1
1 -
2
-
3
-
4
-
5
-
6
-
7
-
8
-
9
-
10
-
11
-
12
-
13
-
14
-
15
-
16
-
17
-
18
-
19
-
20
-
21
-
22
-
23
-
24
-
25
-
26
-
27
-
28
-
29
-
30
-
31
-
32
-
33
-
34
-
35
-
36
-
37
-
38
-
39
-
40
-
41
-
42
-
43
-
44
-
45
-
46
-
47
-
48
-
49
-
50
-
51
-
52
-
53
-
54
-
55
-
56
-
 57
57 -
 58
58 -
 59
59 -
 60
60 -
 61
61 -
 62
62 -
 63
63 -
 64
64 -
 65
65 -
 66
66 -
 67
67 -
 68
68 -
 69
69 -
 70
70 -
 71
71 -
 72
72 -
 73
73 -
 74
74 -
 75
75 -
 76
76 -
 77
77 -
78
-
79
-
80
-
81
-
82
-
83
-
84
-
85
-
86
-
87
-
88
-
89
-
90
-
91
-
92
-
93
-
94
-
95
-
96
-
97
-
98
-
99
-
100
-
101
-
102
-
103
-
104
-
105
-
106
-
107
-
108
-
109
-
110
-
111
-
112
-
113
-
114
-
115
-
116
-
117
-
118
-
119
-
120
-
121
-
122
-
123
-
124
-
125
-
126
-
127
-
128
-
129
-
130
-
131
-
132
-
133
-
134
-
135
-
136
-
137
-
138
-
139
-
140
-
141
-
142
-
143
-
144
-
145
-
146
-
147
-
148
 |
 |

Notes to Consolidated Financial Statements (Continued)
(8) Receivables (Continued)
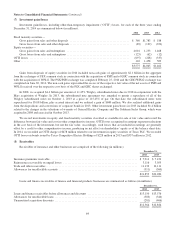
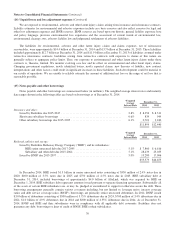
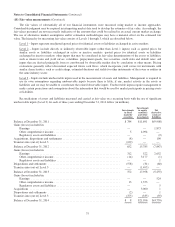
Loans and finance receivables are predominantly installment loans originated or acquired by our manufactured housing
business. Provisions for loan losses for 2014 and 2013 were $173 million and $249 million, respectively. Loan charge-offs, net
of recoveries, were $214 million in 2014 and $266 million in 2013. At December 31, 2014, approximately 97% of the loan
balances were evaluated collectively for impairment. As a part of the evaluation process, credit quality indicators are reviewed
and loans are designated as performing or non-performing. At December 31, 2014, approximately 98% of the loan balances
were determined to be performing and approximately 94% of the loan balances were current as to payment status.
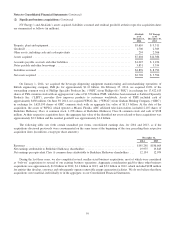
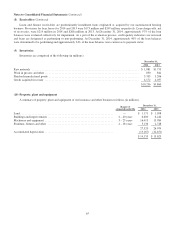
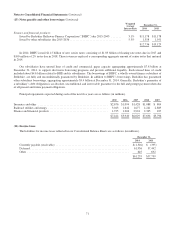
(9) Inventories
Inventories are comprised of the following (in millions).
December 31,
2014 2013
Raw materials ........................................................................... $ 1,881 $1,755
Work in process and other .................................................................. 850 842
Finished manufactured goods ............................................................... 3,333 3,206
Goods acquired for resale .................................................................. 4,172 4,057
$10,236 $9,860
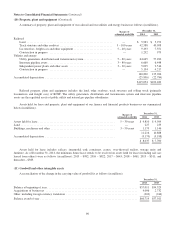
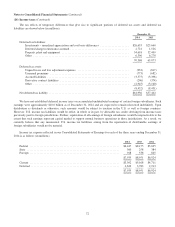
(10) Property, plant and equipment
A summary of property, plant and equipment of our insurance and other businesses follows (in millions).
Ranges of
estimated useful life
December 31,
2014 2013
Land ................................................................. — $ 1,171 $ 1,098
Buildings and improvements .............................................. 2–40years 6,600 6,244
Machinery and equipment ................................................ 3–25years 16,413 15,984
Furniture, fixtures and other .............................................. 2–18years 3,136 2,748
27,320 26,074
Accumulated depreciation ................................................ (13,167) (12,451)
$ 14,153 $ 13,623
65