Berkshire Hathaway 2014 Annual Report Download - page 50
Download and view the complete annual report
Please find page 50 of the 2014 Berkshire Hathaway annual report below. You can navigate through the pages in the report by either clicking on the pages listed below, or by using the keyword search tool below to find specific information within the annual report.-
 1
1 -
2
-
3
-
4
-
5
-
6
-
7
-
8
-
9
-
10
-
11
-
12
-
13
-
14
-
15
-
16
-
17
-
18
-
19
-
20
-
21
-
22
-
23
-
24
-
25
-
26
-
27
-
28
-
29
-
30
-
31
-
32
-
33
-
34
-
35
-
36
-
37
-
38
-
39
-
 40
40 -
 41
41 -
 42
42 -
 43
43 -
 44
44 -
 45
45 -
 46
46 -
 47
47 -
 48
48 -
 49
49 -
 50
50 -
 51
51 -
 52
52 -
 53
53 -
 54
54 -
 55
55 -
 56
56 -
 57
57 -
 58
58 -
 59
59 -
 60
60 -
61
-
62
-
63
-
64
-
65
-
66
-
67
-
68
-
69
-
70
-
71
-
72
-
73
-
74
-
75
-
76
-
77
-
78
-
79
-
80
-
81
-
82
-
83
-
84
-
85
-
86
-
87
-
88
-
89
-
90
-
91
-
92
-
93
-
94
-
95
-
96
-
97
-
98
-
99
-
100
-
101
-
102
-
103
-
104
-
105
-
106
-
107
-
108
-
109
-
110
-
111
-
112
-
113
-
114
-
115
-
116
-
117
-
118
-
119
-
120
-
121
-
122
-
123
-
124
-
125
-
126
-
127
-
128
-
129
-
130
-
131
-
132
-
133
-
134
-
135
-
136
-
137
-
138
-
139
-
140
-
141
-
142
-
143
-
144
-
145
-
146
-
147
-
148
 |
 |

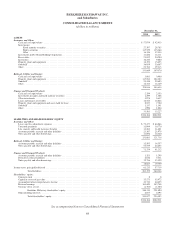
BERKSHIRE HATHAWAY INC.
and Subsidiaries
CONSOLIDATED BALANCE SHEETS
(dollars in millions)
December 31,
2014 2013
ASSETS
Insurance and Other:
Cash and cash equivalents ................................................................................... $ 57,974 $ 42,433
Investments:
Fixed maturity securities ................................................................................. 27,397 28,785
Equity securities ....................................................................................... 115,529 115,464
Other ................................................................................................ 16,346 12,334
Investments in H.J. Heinz Holding Corporation ................................................................... 11,660 12,111
Receivables ............................................................................................... 21,852 20,280
Inventories ................................................................................................ 10,236 9,860
Property, plant and equipment ................................................................................ 14,153 13,623
Goodwill ................................................................................................. 34,959 33,067
Other .................................................................................................... 23,763 19,113
333,869 307,070
Railroad, Utilities and Energy:
Cash and cash equivalents ................................................................................... 3,001 3,400
Property, plant and equipment ................................................................................ 115,054 102,482
Goodwill ................................................................................................. 24,418 22,603
Other .................................................................................................... 16,343 16,149
158,816 144,634
Finance and Financial Products:
Cash and cash equivalents ................................................................................... 2,294 2,353
Investments in equity and fixed maturity securities ................................................................ 1,299 1,506
Other investments .......................................................................................... 5,978 5,617
Loans and finance receivables ................................................................................ 12,566 12,826
Property, plant and equipment and assets held for lease ............................................................. 8,037 7,700
Goodwill ................................................................................................. 1,337 1,341
Other .................................................................................................... 1,990 1,884
33,501 33,227
$526,186 $484,931
LIABILITIES AND SHAREHOLDERS’ EQUITY
Insurance and Other:
Losses and loss adjustment expenses ........................................................................... $ 71,477 $ 64,866
Unearned premiums ........................................................................................ 11,944 10,770
Life, annuity and health insurance benefits ...................................................................... 13,261 11,681
Accounts payable, accruals and other liabilities ................................................................... 23,307 21,979
Notes payable and other borrowings ............................................................................ 11,894 12,440
131,883 121,736
Railroad, Utilities and Energy:
Accounts payable, accruals and other liabilities ................................................................... 15,595 14,557
Notes payable and other borrowings ............................................................................ 55,579 46,655
71,174 61,212
Finance and Financial Products:
Accounts payable, accruals and other liabilities ................................................................... 1,321 1,299
Derivative contract liabilities ................................................................................. 4,810 5,331
Notes payable and other borrowings ............................................................................ 12,736 13,129
18,867 19,759
Income taxes, principally deferred ................................................................................. 61,235 57,739
Total liabilities .................................................................................... 283,159 260,446
Shareholders’ equity:
Common stock ............................................................................................ 8 8
Capital in excess of par value ................................................................................. 35,573 35,472
Accumulated other comprehensive income ...................................................................... 42,732 44,025
Retained earnings .......................................................................................... 163,620 143,748
Treasury stock, at cost ....................................................................................... (1,763) (1,363)
Berkshire Hathaway shareholders’ equity ............................................................... 240,170 221,890
Noncontrolling interests ..................................................................................... 2,857 2,595
Total shareholders’ equity ............................................................................ 243,027 224,485
$526,186 $484,931
See accompanying Notes to Consolidated Financial Statements
48