Berkshire Hathaway 2014 Annual Report Download - page 5
Download and view the complete annual report
Please find page 5 of the 2014 Berkshire Hathaway annual report below. You can navigate through the pages in the report by either clicking on the pages listed below, or by using the keyword search tool below to find specific information within the annual report.-
 1
1 -
 2
2 -
 3
3 -
 4
4 -
 5
5 -
 6
6 -
 7
7 -
 8
8 -
 9
9 -
 10
10 -
 11
11 -
 12
12 -
 13
13 -
 14
14 -
 15
15 -
 16
16 -
17
-
18
-
19
-
20
-
21
-
22
-
23
-
24
-
25
-
26
-
27
-
28
-
29
-
30
-
31
-
32
-
33
-
34
-
35
-
36
-
37
-
38
-
39
-
40
-
41
-
42
-
43
-
44
-
45
-
46
-
47
-
48
-
49
-
50
-
51
-
52
-
53
-
54
-
55
-
56
-
57
-
58
-
59
-
60
-
61
-
62
-
63
-
64
-
65
-
66
-
67
-
68
-
69
-
70
-
71
-
72
-
73
-
74
-
75
-
76
-
77
-
78
-
79
-
80
-
81
-
82
-
83
-
84
-
85
-
86
-
87
-
88
-
89
-
90
-
91
-
92
-
93
-
94
-
95
-
96
-
97
-
98
-
99
-
100
-
101
-
102
-
103
-
104
-
105
-
106
-
107
-
108
-
109
-
110
-
111
-
112
-
113
-
114
-
115
-
116
-
117
-
118
-
119
-
120
-
121
-
122
-
123
-
124
-
125
-
126
-
127
-
128
-
129
-
130
-
131
-
132
-
133
-
134
-
135
-
136
-
137
-
138
-
139
-
140
-
141
-
142
-
143
-
144
-
145
-
146
-
147
-
148
 |
 |

A note to readers: Fifty years ago, today’s management took charge at Berkshire. For this Golden Anniversary,
Warren Buffett and Charlie Munger each wrote his views of what has happened at Berkshire during the past 50
years and what each expects during the next 50. Neither changed a word of his commentary after reading what the
other had written. Warren’s thoughts begin on page 24 and Charlie’s on page 39. Shareholders, particularly new
ones, may find it useful to read those letters before reading the report on 2014, which begins below.
BERKSHIRE HATHAWAY INC.
To the Shareholders of Berkshire Hathaway Inc.:
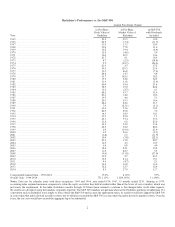
Berkshire’s gain in net worth during 2014 was $18.3 billion, which increased the per-share book value of
both our Class A and Class B stock by 8.3%. Over the last 50 years (that is, since present management took over),
per-share book value has grown from $19 to $146,186, a rate of 19.4% compounded annually.*
During our tenure, we have consistently compared the yearly performance of the S&P 500 to the change in
Berkshire’s per-share book value. We’ve done that because book value has been a crude, but useful, tracking device
for the number that really counts: intrinsic business value.
In our early decades, the relationship between book value and intrinsic value was much closer than it is
now. That was true because Berkshire’s assets were then largely securities whose values were continuously restated
to reflect their current market prices. In Wall Street parlance, most of the assets involved in the calculation of book
value were “marked to market.”
Today, our emphasis has shifted in a major way to owning and operating large businesses. Many of these
are worth far more than their cost-based carrying value. But that amount is never revalued upward no matter how
much the value of these companies has increased. Consequently, the gap between Berkshire’s intrinsic value and its
book value has materially widened.
With that in mind, we have added a new set of data – the historical record of Berkshire’s stock price – to
the performance table on the facing page. Market prices, let me stress, have their limitations in the short term.
Monthly or yearly movements of stocks are often erratic and not indicative of changes in intrinsic value. Over time,
however, stock prices and intrinsic value almost invariably converge. Charlie Munger, Berkshire Vice Chairman
and my partner, and I believe that has been true at Berkshire: In our view, the increase in Berkshire’s per-share
intrinsic value over the past 50 years is roughly equal to the 1,826,163% gain in market price of the company’s
shares.
* All per-share figures used in this report apply to Berkshire’s A shares. Figures for the B shares are 1/1500th of
those shown for A.
3