Berkshire Hathaway 2014 Annual Report Download - page 66
Download and view the complete annual report
Please find page 66 of the 2014 Berkshire Hathaway annual report below. You can navigate through the pages in the report by either clicking on the pages listed below, or by using the keyword search tool below to find specific information within the annual report.-
 1
1 -
2
-
3
-
4
-
5
-
6
-
7
-
8
-
9
-
10
-
11
-
12
-
13
-
14
-
15
-
16
-
17
-
18
-
19
-
20
-
21
-
22
-
23
-
24
-
25
-
26
-
27
-
28
-
29
-
30
-
31
-
32
-
33
-
34
-
35
-
36
-
37
-
38
-
39
-
40
-
41
-
42
-
43
-
44
-
45
-
46
-
47
-
48
-
49
-
50
-
51
-
52
-
53
-
54
-
55
-
 56
56 -
 57
57 -
 58
58 -
 59
59 -
 60
60 -
 61
61 -
 62
62 -
 63
63 -
 64
64 -
 65
65 -
 66
66 -
 67
67 -
 68
68 -
 69
69 -
 70
70 -
 71
71 -
 72
72 -
 73
73 -
 74
74 -
 75
75 -
 76
76 -
77
-
78
-
79
-
80
-
81
-
82
-
83
-
84
-
85
-
86
-
87
-
88
-
89
-
90
-
91
-
92
-
93
-
94
-
95
-
96
-
97
-
98
-
99
-
100
-
101
-
102
-
103
-
104
-
105
-
106
-
107
-
108
-
109
-
110
-
111
-
112
-
113
-
114
-
115
-
116
-
117
-
118
-
119
-
120
-
121
-
122
-
123
-
124
-
125
-
126
-
127
-
128
-
129
-
130
-
131
-
132
-
133
-
134
-
135
-
136
-
137
-
138
-
139
-
140
-
141
-
142
-
143
-
144
-
145
-
146
-
147
-
148
 |
 |

Notes to Consolidated Financial Statements (Continued)
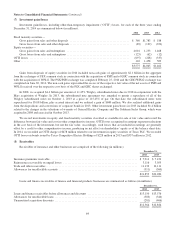
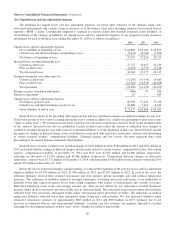
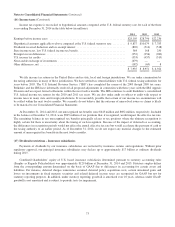
(7) Investment gains/losses
Investment gains/losses, including other-than-temporary impairment (“OTTI”) losses, for each of the three years ending
December 31, 2014 are summarized below (in millions).
2014 2013 2012
Fixed maturity securities—
Gross gains from sales and other disposals .......................................... $ 360 $1,783 $ 188
Gross losses from sales and other disposals .......................................... (89) (139) (354)
Equity securities—
Gross gains from sales and redemptions ............................................ 4,016 1,253 1,468
Gross losses from sales and redemptions ............................................ (125) (62) (12)
OTTI losses ...................................................................... (697) (228) (337)
Other ............................................................................ 110 1,458 509
$3,575 $4,065 $1,462
Gains from disposals of equity securities in 2014 included non-cash gains of approximately $2.1 billion in the aggregate
from the exchanges of PSX common stock in connection with the acquisition of PSPI and of GHC common stock in connection
with the acquisition of WPLG. The PSX/PSPI exchange was completed February 25, 2014 and the GHC/WPLG exchange was
completed on June 30, 2014. The non-cash gains represented the excess of the respective fair value of the net assets of PSPI and
WPLG received over the respective cost basis of the PSX and GHC shares exchanged.
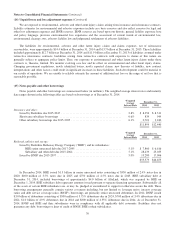
In 2008, we acquired $4.4 billion par amount of 11.45% Wrigley subordinated notes due in 2018 in conjunction with the
Mars acquisition of Wrigley. In 2013, the subordinated note agreement was amended to permit a repurchase of all of the
Wrigley subordinated notes on October 1, 2013 at a price of 115.45% of par. On that date, the subordinated notes were
repurchased for $5.08 billion, plus accrued interest and we realized a gain of $680 million. We also realized additional gains
from the dispositions and conversions of corporate bonds in 2013. Other investment gains/losses in 2013 included $1.4 billion
related to the changes in the valuations of warrants of General Electric Company and The Goldman Sachs Group, which were
acquired in 2008 and exercised in October 2013.
We record investments in equity and fixed maturity securities classified as available-for-sale at fair value and record the
difference between fair value and cost in other comprehensive income. OTTI losses recognized in earnings represent reductions
in the cost basis of the investment, but not the fair value. Accordingly, such losses that are included in earnings are generally
offset by a credit to other comprehensive income, producing no net effect on shareholders’ equity as of the balance sheet date.
In 2014, we recorded an OTTI charge of $678 million related to our investment in equity securities of Tesco PLC. We recorded
OTTI losses on bonds issued by Texas Competitive Electric Holdings of $228 million in 2013 and $337 million in 2012.
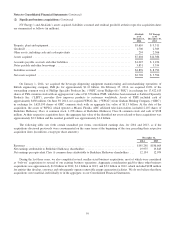
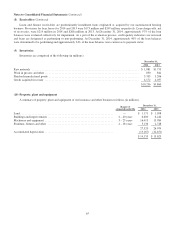
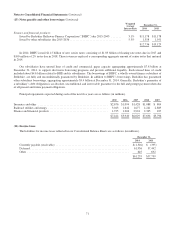
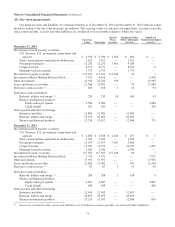
(8) Receivables
Receivables of insurance and other businesses are comprised of the following (in millions).
December 31,
2014 2013
Insurance premiums receivable ............................................................. $ 7,914 $ 7,474
Reinsurance recoverable on unpaid losses .................................................... 3,116 3,055
Trade and other receivables ................................................................ 11,133 10,111
Allowances for uncollectible accounts ....................................................... (311) (360)
$21,852 $20,280
Loans and finance receivables of finance and financial products businesses are summarized as follows (in millions).
December 31,
2014 2013
Loans and finance receivables before allowances and discounts ................................... $13,150 $13,576
Allowances for uncollectible loans .......................................................... (303) (344)
Unamortized acquisition discounts .......................................................... (281) (406)
$12,566 $12,826
64