Berkshire Hathaway 2014 Annual Report Download - page 10
Download and view the complete annual report
Please find page 10 of the 2014 Berkshire Hathaway annual report below. You can navigate through the pages in the report by either clicking on the pages listed below, or by using the keyword search tool below to find specific information within the annual report.-
 1
1 -
 2
2 -
 3
3 -
 4
4 -
 5
5 -
 6
6 -
 7
7 -
 8
8 -
 9
9 -
 10
10 -
 11
11 -
 12
12 -
 13
13 -
 14
14 -
 15
15 -
 16
16 -
 17
17 -
 18
18 -
 19
19 -
 20
20 -
 21
21 -
22
-
23
-
24
-
25
-
26
-
27
-
28
-
29
-
30
-
31
-
32
-
33
-
34
-
35
-
36
-
37
-
38
-
39
-
40
-
41
-
42
-
43
-
44
-
45
-
46
-
47
-
48
-
49
-
50
-
51
-
52
-
53
-
54
-
55
-
56
-
57
-
58
-
59
-
60
-
61
-
62
-
63
-
64
-
65
-
66
-
67
-
68
-
69
-
70
-
71
-
72
-
73
-
74
-
75
-
76
-
77
-
78
-
79
-
80
-
81
-
82
-
83
-
84
-
85
-
86
-
87
-
88
-
89
-
90
-
91
-
92
-
93
-
94
-
95
-
96
-
97
-
98
-
99
-
100
-
101
-
102
-
103
-
104
-
105
-
106
-
107
-
108
-
109
-
110
-
111
-
112
-
113
-
114
-
115
-
116
-
117
-
118
-
119
-
120
-
121
-
122
-
123
-
124
-
125
-
126
-
127
-
128
-
129
-
130
-
131
-
132
-
133
-
134
-
135
-
136
-
137
-
138
-
139
-
140
-
141
-
142
-
143
-
144
-
145
-
146
-
147
-
148
 |
 |

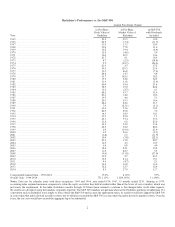
Since 1970, our per-share investments have increased at a rate of 19% compounded annually, and our
earnings figure has grown at a 20.6% clip. It is no coincidence that the price of Berkshire stock over the ensuing 44
years has increased at a rate very similar to that of our two measures of value. Charlie and I like to see gains in both
sectors, but our main focus is to build operating earnings. That’s why we were pleased to exchange our Phillips 66
and Graham Holdings stock for operating businesses last year and to contract with Procter and Gamble to acquire
Duracell by means of a similar exchange set to close in 2015.
************
Now, let’s examine the four major sectors of our operations. Each has vastly different balance sheet and
income characteristics from the others. So we’ll present them as four separate businesses, which is how Charlie and
I view them (though there are important and enduring advantages to having them all under one roof). Our goal is to
provide you with the information we would wish to have if our positions were reversed, with you being the
reporting manager and we the absentee shareholders. (But don’t get any ideas!)
Insurance
Let’s look first at insurance, Berkshire’s core operation. That industry has been the engine that has
propelled our expansion since 1967, when we acquired National Indemnity and its sister company, National Fire &
Marine, for $8.6 million. Though that purchase had monumental consequences for Berkshire, its execution was
simplicity itself.
Jack Ringwalt, a friend of mine who was the controlling shareholder of the two companies, came to my
office saying he would like to sell. Fifteen minutes later, we had a deal. Neither of Jack’s companies had ever had an
audit by a public accounting firm, and I didn’t ask for one. My reasoning: (1) Jack was honest and (2) He was also a
bit quirky and likely to walk away if the deal became at all complicated.
On pages 128-129, we reproduce the 1
1
⁄
2
-page purchase agreement we used to finalize the transaction.
That contract was homemade: Neither side used a lawyer. Per page, this has to be Berkshire’s best deal: National
Indemnity today has GAAP (generally accepted accounting principles) net worth of $111 billion, which exceeds that
of any other insurer in the world.
One reason we were attracted to the property-casualty business was its financial characteristics: P/C
insurers receive premiums upfront and pay claims later. In extreme cases, such as those arising from certain
workers’ compensation accidents, payments can stretch over many decades. This collect-now, pay-later model
leaves P/C companies holding large sums – money we call “float” – that will eventually go to others. Meanwhile,
insurers get to invest this float for their benefit. Though individual policies and claims come and go, the amount of
float an insurer holds usually remains fairly stable in relation to premium volume. Consequently, as our business
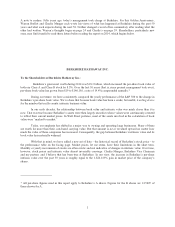
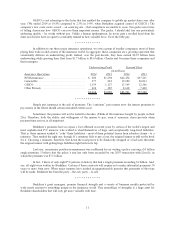
grows, so does our float. And how we have grown, as the following table shows:
Year Float (in $ millions)
1970 $ 39
1980 237
1990 1,632
2000 27,871
2010 65,832
2014 83,921
Further gains in float will be tough to achieve. On the plus side, GEICO and our new commercial
insurance operation are almost certain to grow at a good clip. National Indemnity’s reinsurance division, however, is
party to a number of run-off contracts whose float drifts downward. If we do in time experience a decline in float, it
will be very gradual – at the outside no more than 3% in any year. The nature of our insurance contracts is such that
we can never be subject to immediate demands for sums that are large compared to our cash resources. This strength
is a key pillar in Berkshire’s economic fortress.
8