Berkshire Hathaway 2014 Annual Report Download - page 53
Download and view the complete annual report
Please find page 53 of the 2014 Berkshire Hathaway annual report below. You can navigate through the pages in the report by either clicking on the pages listed below, or by using the keyword search tool below to find specific information within the annual report.-
 1
1 -
2
-
3
-
4
-
5
-
6
-
7
-
8
-
9
-
10
-
11
-
12
-
13
-
14
-
15
-
16
-
17
-
18
-
19
-
20
-
21
-
22
-
23
-
24
-
25
-
26
-
27
-
28
-
29
-
30
-
31
-
32
-
33
-
34
-
35
-
36
-
37
-
38
-
39
-
40
-
41
-
42
-
 43
43 -
 44
44 -
 45
45 -
 46
46 -
 47
47 -
 48
48 -
 49
49 -
 50
50 -
 51
51 -
 52
52 -
 53
53 -
 54
54 -
 55
55 -
 56
56 -
 57
57 -
 58
58 -
 59
59 -
 60
60 -
 61
61 -
 62
62 -
 63
63 -
64
-
65
-
66
-
67
-
68
-
69
-
70
-
71
-
72
-
73
-
74
-
75
-
76
-
77
-
78
-
79
-
80
-
81
-
82
-
83
-
84
-
85
-
86
-
87
-
88
-
89
-
90
-
91
-
92
-
93
-
94
-
95
-
96
-
97
-
98
-
99
-
100
-
101
-
102
-
103
-
104
-
105
-
106
-
107
-
108
-
109
-
110
-
111
-
112
-
113
-
114
-
115
-
116
-
117
-
118
-
119
-
120
-
121
-
122
-
123
-
124
-
125
-
126
-
127
-
128
-
129
-
130
-
131
-
132
-
133
-
134
-
135
-
136
-
137
-
138
-
139
-
140
-
141
-
142
-
143
-
144
-
145
-
146
-
147
-
148
 |
 |

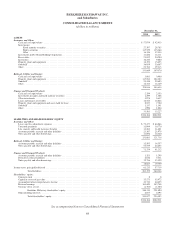
BERKSHIRE HATHAWAY INC.
and Subsidiaries
CONSOLIDATED STATEMENTS OF CASH FLOWS
(dollars in millions)
Year Ended December 31,
2014 2013 2012
Cash flows from operating activities:
Net earnings ................................................................ $20,170 $ 19,845 $ 15,312
Adjustments to reconcile net earnings to operating cash flows:
Investment gains/losses ................................................... (3,575) (4,065) (1,462)
Depreciation and amortization ............................................. 7,370 6,508 6,154
Other ................................................................. (341) 373 (213)
Changes in operating assets and liabilities before business acquisitions:
Losses and loss adjustment expenses ........................................ 7,404 578 (421)
Deferred charges reinsurance assumed ....................................... (3,413) (340) 121
Unearned premiums ...................................................... 1,159 519 1,134
Receivables and originated loans ........................................... (1,890) 1,035 (1,610)
Derivative contract assets and liabilities ...................................... (520) (2,430) (2,183)
Income taxes ........................................................... 4,905 3,514 1,710
Other ................................................................. 741 2,167 2,408
Net cash flows from operating activities .......................................... 32,010 27,704 20,950
Cash flows from investing activities:
Purchases of fixed maturity securities ............................................ (7,774) (7,546) (8,250)
Purchases of equity securities .................................................. (7,014) (8,558) (7,376)
Investments in H.J. Heinz Holding Corp. and other investments ....................... (3,000) (12,250) —
Sales of fixed maturity securities ............................................... 1,697 4,311 2,982
Redemptions and maturities of fixed maturity securities ............................. 6,795 11,203 6,064
Sales and redemptions of equity securities ........................................ 8,896 3,869 8,088
Purchases of loans and finance receivables ........................................ (181) (490) (650)
Collections of loans and finance receivables ...................................... 885 654 1,714
Acquisitions of businesses, net of cash acquired ................................... (4,824) (6,431) (3,188)
Purchases of property, plant and equipment ....................................... (15,185) (11,087) (9,775)
Other ..................................................................... 336 (1,210) (183)
Net cash flows from investing activities .......................................... (19,369) (27,535) (10,574)
Cash flows from financing activities:
Proceeds from borrowings of insurance and other businesses ......................... 845 2,622 1,820
Proceeds from borrowings of railroad, utilities and energy businesses .................. 5,765 7,491 4,707
Proceeds from borrowings of finance businesses ................................... 1,148 3,462 2,352
Repayments of borrowings of insurance and other businesses ......................... (1,289) (2,750) (1,999)
Repayments of borrowings of railroad, utilities and energy businesses .................. (1,862) (1,596) (2,119)
Repayments of borrowings of finance businesses .................................. (1,543) (3,927) (3,210)
Changes in short term borrowings, net ........................................... 932 (1,317) (309)
Acquisitions of noncontrolling interests and treasury stock ........................... (1,287) (2,890) (2,096)
Other ..................................................................... 22 (134) 48
Net cash flows from financing activities .......................................... 2,731 961 (806)
Effects of foreign currency exchange rate changes ...................................... (289) 64 123
Increase in cash and cash equivalents ................................................ 15,083 1,194 9,693
Cash and cash equivalents at beginning of year ........................................ 48,186 46,992 37,299
Cash and cash equivalents at end of year * .......................................... $63,269 $ 48,186 $ 46,992
* Cash and cash equivalents at end of year are comprised of the following:
Insurance and Other ......................................................... $ 57,974 $ 42,433 $ 42,186
Railroad, Utilities and Energy ................................................. 3,001 3,400 2,570
Finance and Financial Products ................................................ 2,294 2,353 2,236
$ 63,269 $ 48,186 $ 46,992
See accompanying Notes to Consolidated Financial Statements
51