Berkshire Hathaway 2014 Annual Report Download - page 90
Download and view the complete annual report
Please find page 90 of the 2014 Berkshire Hathaway annual report below. You can navigate through the pages in the report by either clicking on the pages listed below, or by using the keyword search tool below to find specific information within the annual report.-
 1
1 -
2
-
3
-
4
-
5
-
6
-
7
-
8
-
9
-
10
-
11
-
12
-
13
-
14
-
15
-
16
-
17
-
18
-
19
-
20
-
21
-
22
-
23
-
24
-
25
-
26
-
27
-
28
-
29
-
30
-
31
-
32
-
33
-
34
-
35
-
36
-
37
-
38
-
39
-
40
-
41
-
42
-
43
-
44
-
45
-
46
-
47
-
48
-
49
-
50
-
51
-
52
-
53
-
54
-
55
-
56
-
57
-
58
-
59
-
60
-
61
-
62
-
63
-
64
-
65
-
66
-
67
-
68
-
69
-
70
-
71
-
72
-
73
-
74
-
75
-
76
-
77
-
78
-
79
-
 80
80 -
 81
81 -
 82
82 -
 83
83 -
 84
84 -
 85
85 -
 86
86 -
 87
87 -
 88
88 -
 89
89 -
 90
90 -
 91
91 -
 92
92 -
 93
93 -
 94
94 -
 95
95 -
 96
96 -
 97
97 -
 98
98 -
 99
99 -
 100
100 -
101
-
102
-
103
-
104
-
105
-
106
-
107
-
108
-
109
-
110
-
111
-
112
-
113
-
114
-
115
-
116
-
117
-
118
-
119
-
120
-
121
-
122
-
123
-
124
-
125
-
126
-
127
-
128
-
129
-
130
-
131
-
132
-
133
-
134
-
135
-
136
-
137
-
138
-
139
-
140
-
141
-
142
-
143
-
144
-
145
-
146
-
147
-
148
 |
 |

Management’s Discussion (Continued)
Insurance—Underwriting (Continued)
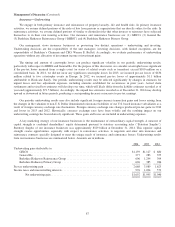
GEICO
Through GEICO, we primarily write private passenger automobile insurance, offering coverages to insureds in all 50 states
and the District of Columbia. GEICO’s policies are marketed mainly by direct response methods in which customers apply for
coverage directly to the company via the Internet or over the telephone. This is a significant element in our strategy to be a low-
cost auto insurer. In addition, we strive to provide excellent service to customers, with the goal of establishing long-term
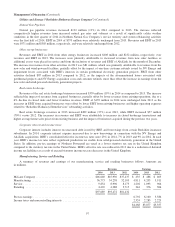
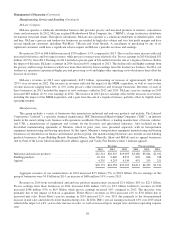
customer relationships. GEICO’s underwriting results are summarized below. Dollars are in millions.
2014 2013 2012
Amount % Amount % Amount %
Premiums written ........................................... $20,962 $19,083 $17,129
Premiums earned ............................................ $20,496 100.0 $18,572 100.0 $16,740 100.0
Losses and loss adjustment expenses ............................ 15,924 77.7 14,255 76.7 12,700 75.9
Underwriting expenses ....................................... 3,413 16.6 3,190 17.2 3,360 20.0
Total losses and expenses ..................................... 19,337 94.3 17,445 93.9 16,060 95.9
Pre-tax underwriting gain ..................................... $ 1,159 $ 1,127 $ 680
Premiums written and earned in 2014 were approximately $21.0 billion and $20.5 billion, respectively, which represented
increases of 9.8% and 10.4%, respectively compared to premiums written and earned in 2013. These increases were attributable
to an increase in voluntary auto policies-in-force of 6.6% during the past twelve months and increased average premium per
policy. Voluntary auto new business sales increased about 1.8% in 2014 as compared to 2013. Voluntary auto policies-in-force
at December 31, 2014 were approximately 821,000 higher than at December 31, 2013.
Losses and loss adjustment expenses incurred in 2014 increased $1.7 billion (11.7%) to $15.9 billion. The ratio of losses
and loss adjustment expenses incurred to premiums earned (the “loss ratio”) was 77.7% in 2014 compared to 76.7% in 2013. In
2014, claims frequencies for property damage and collision coverages increased in the three to four percent range over 2013,
partially due to more severe winter weather in the first quarter of 2014. Claims frequencies for bodily injury coverage increased
about one percent, while frequencies for personal injury protection decreased three to four percent. Physical damage severities
increased one to two percent in 2014 and bodily injury severities decreased in the one to two percent range from severities in
2013. Overall, personal injury protection severities were relatively flat although we experienced relatively large, but offsetting,
changes by jurisdiction. In both 2014 and 2013, losses and loss adjustment expenses incurred were favorably impacted by
reductions of estimates for prior years’ losses.
Underwriting expenses in 2014 increased $223 million (7.0%) to $3.4 billion. The increase reflected the increased policy
acquisition costs to generate the growth in policies-in-force and increased other operating expenses. The ratio of underwriting
expenses to premiums earned (the “expense ratio”) was 16.6% in 2014 and 17.2% in 2013.
Premiums written in 2013 were $19.1 billion, an increase of 11.4% over premiums written in 2012. Premiums earned in
2013 increased approximately $1.8 billion (10.9%) to approximately $18.6 billion. The growth in premiums reflected an
increase in voluntary auto policies-in-force of 7.8% and to a lesser degree, higher average premiums per policy. The increase in
policies-in-force reflected a 12.1% increase in voluntary auto new business sales. Voluntary auto policies-in-force at
December 31, 2013 were approximately 898,000 greater than at December 31, 2012.
Losses and loss adjustment expenses incurred in 2013 increased $1.6 billion (12.2%) to $14.3 billion. The loss ratio was
76.7% in 2013 compared to 75.9% in 2012. In 2013, claims frequencies for property damage and collision coverages generally
increased in the two to four percent range and physical damage claims severities increased in the three to four percent range as
compared to 2012. In addition, average bodily injury claims frequencies increased in the one to two percent range. Bodily injury
claims severities increased in the one to three percent range, although severities for personal injury protection coverage
declined, primarily in Florida. In 2012, we incurred losses of approximately $490 million related to Hurricane Sandy. In both
2013 and 2012, losses and loss adjustment expenses incurred were favorably impacted by reductions of estimates for prior
years’ losses.
Underwriting expenses incurred in 2013 declined $170 million (5.1%) to $3.2 billion. Underwriting expenses in 2012 were
impacted by a change in U.S. GAAP concerning deferred policy acquisition costs. Excluding the effects of the accounting
change, the expense ratio in 2013 declined by approximately 0.4 percentage points from 2012.
88