Berkshire Hathaway 2014 Annual Report Download - page 81
Download and view the complete annual report
Please find page 81 of the 2014 Berkshire Hathaway annual report below. You can navigate through the pages in the report by either clicking on the pages listed below, or by using the keyword search tool below to find specific information within the annual report.-
 1
1 -
2
-
3
-
4
-
5
-
6
-
7
-
8
-
9
-
10
-
11
-
12
-
13
-
14
-
15
-
16
-
17
-
18
-
19
-
20
-
21
-
22
-
23
-
24
-
25
-
26
-
27
-
28
-
29
-
30
-
31
-
32
-
33
-
34
-
35
-
36
-
37
-
38
-
39
-
40
-
41
-
42
-
43
-
44
-
45
-
46
-
47
-
48
-
49
-
50
-
51
-
52
-
53
-
54
-
55
-
56
-
57
-
58
-
59
-
60
-
61
-
62
-
63
-
64
-
65
-
66
-
67
-
68
-
69
-
70
-
 71
71 -
 72
72 -
 73
73 -
 74
74 -
 75
75 -
 76
76 -
 77
77 -
 78
78 -
 79
79 -
 80
80 -
 81
81 -
 82
82 -
 83
83 -
 84
84 -
 85
85 -
 86
86 -
 87
87 -
 88
88 -
 89
89 -
 90
90 -
 91
91 -
92
-
93
-
94
-
95
-
96
-
97
-
98
-
99
-
100
-
101
-
102
-
103
-
104
-
105
-
106
-
107
-
108
-
109
-
110
-
111
-
112
-
113
-
114
-
115
-
116
-
117
-
118
-
119
-
120
-
121
-
122
-
123
-
124
-
125
-
126
-
127
-
128
-
129
-
130
-
131
-
132
-
133
-
134
-
135
-
136
-
137
-
138
-
139
-
140
-
141
-
142
-
143
-
144
-
145
-
146
-
147
-
148
 |
 |

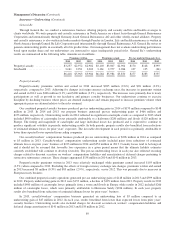
Notes to Consolidated Financial Statements (Continued)
(21) Pension plans
Several of our subsidiaries individually sponsor defined benefit pension plans covering certain employees. Benefits under
the plans are generally based on years of service and compensation, although benefits under certain plans are based on years of
service and fixed benefit rates. Our subsidiaries may make contributions to the plans to meet regulatory requirements and may
also make discretionary contributions.
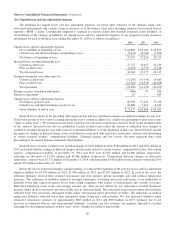
The components of net periodic pension expense for each of the three years ending December 31, 2014 are as follows
(in millions).
2014 2013 2012
Service cost ......................................................................... $230 $254 $247
Interest cost ......................................................................... 629 547 583
Expected return on plan assets .......................................................... (772) (634) (610)
Amortization of actuarial losses and other ................................................. 102 225 220
Net periodic pension expense ........................................................... $189 $392 $440
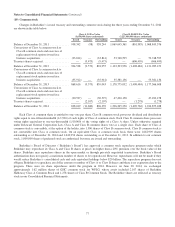
The accumulated benefit obligation is the actuarial present value of benefits earned based on service and compensation
prior to the valuation date. The projected benefit obligation (“PBO”) is the actuarial present value of benefits earned based upon
service and compensation prior to the valuation date and, if applicable, includes assumptions regarding future compensation
levels. Benefit obligations under qualified U.S. defined benefit pension plans are funded through assets held in trusts. Pension
obligations under certain non-U.S. plans and non-qualified U.S. plans are unfunded. The aggregate PBO of non-qualified U.S.
plans and non-U.S. plans which are not funded by assets held in trusts was approximately $1.2 billion and $1.0 billion as of
December 31, 2014 and 2013, respectively.
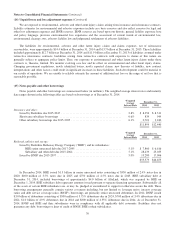
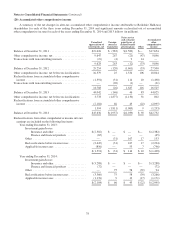
Reconciliations of the changes in plan assets and PBOs related to BHE’s pension plans and all other pension plans for each
of the two years ending December 31, 2014 are in the following tables (in millions). BHE’s pension plans cover employees of
its various regulated subsidiaries. The costs associated with these regulated operations are generally recoverable through the
regulated rate making process.
2014 2013
BHE All other Consolidated BHE All other Consolidated
Benefit obligations
Accumulated benefit obligation at end of year ............ $5,105 $ 9,522 $14,627 $4,664 $8,101 $12,765
PBO at beginning of year ............................. $5,006 $ 8,892 $13,898 $4,284 $9,789 $14,073
Service cost ................................... 60 170 230 46 208 254
Interest cost ................................... 226 403 629 172 375 547
Benefits paid ................................... (310) (524) (834) (275) (505) (780)
Business acquisitions ............................ — 11 11 823 — 823
Actuarial (gains) or losses and other ................ 416 1,537 1,953 (44) (975) (1,019)
PBO at end of year .................................. $5,398 $10,489 $15,887 $5,006 $8,892 $13,898
Plan assets
Plan assets at beginning of year ........................ $4,888 $ 8,389 $13,277 $3,651 $6,785 $10,436
Employer contributions .......................... 126 122 248 150 274 424
Benefits paid ................................... (310) (524) (834) (275) (505) (780)
Actual return on plan assets ....................... 525 338 863 497 1,849 2,346
Business acquisitions ............................ — 1 1 818 — 818
Other ......................................... (143) (46) (189) 47 (14) 33
Plan assets at end of year ............................. $5,086 $ 8,280 $13,366 $4,888 $8,389 $13,277
Net funded status – net liability ........................ $ 312 $ 2,209 $ 2,521 $ 118 $ 503 $ 621
79