Berkshire Hathaway 2014 Annual Report Download - page 82
Download and view the complete annual report
Please find page 82 of the 2014 Berkshire Hathaway annual report below. You can navigate through the pages in the report by either clicking on the pages listed below, or by using the keyword search tool below to find specific information within the annual report.-
 1
1 -
2
-
3
-
4
-
5
-
6
-
7
-
8
-
9
-
10
-
11
-
12
-
13
-
14
-
15
-
16
-
17
-
18
-
19
-
20
-
21
-
22
-
23
-
24
-
25
-
26
-
27
-
28
-
29
-
30
-
31
-
32
-
33
-
34
-
35
-
36
-
37
-
38
-
39
-
40
-
41
-
42
-
43
-
44
-
45
-
46
-
47
-
48
-
49
-
50
-
51
-
52
-
53
-
54
-
55
-
56
-
57
-
58
-
59
-
60
-
61
-
62
-
63
-
64
-
65
-
66
-
67
-
68
-
69
-
70
-
71
-
 72
72 -
 73
73 -
 74
74 -
 75
75 -
 76
76 -
 77
77 -
 78
78 -
 79
79 -
 80
80 -
 81
81 -
 82
82 -
 83
83 -
 84
84 -
 85
85 -
 86
86 -
 87
87 -
 88
88 -
 89
89 -
 90
90 -
 91
91 -
 92
92 -
93
-
94
-
95
-
96
-
97
-
98
-
99
-
100
-
101
-
102
-
103
-
104
-
105
-
106
-
107
-
108
-
109
-
110
-
111
-
112
-
113
-
114
-
115
-
116
-
117
-
118
-
119
-
120
-
121
-
122
-
123
-
124
-
125
-
126
-
127
-
128
-
129
-
130
-
131
-
132
-
133
-
134
-
135
-
136
-
137
-
138
-
139
-
140
-
141
-
142
-
143
-
144
-
145
-
146
-
147
-
148
 |
 |

Notes to Consolidated Financial Statements (Continued)
(21) Pension plans (Continued)
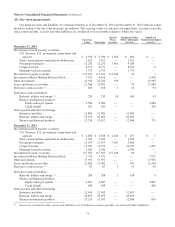
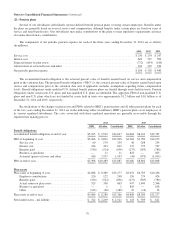
Weighted average interest rate assumptions used in determining projected benefit obligations and net periodic pension
expense were as follows.
2014 2013
Applicable to pension benefit obligations:
Discount rate .............................................................................. 3.8% 4.6%
Expected long-term rate of return on plan assets .................................................. 6.7 6.7
Rate of compensation increase ................................................................ 3.4 3.5
Discount rate applicable to net periodic pension expense ............................................... 4.6 4.1
Benefits payments expected over the next ten years are as follows (in millions): 2015 – $840; 2016 – $847; 2017 – $861;
2018 – $868; 2019 – $889; and 2020 to 2024 – $4,511. Sponsoring subsidiaries expect to contribute $211 million to defined
benefit pension plans in 2015.
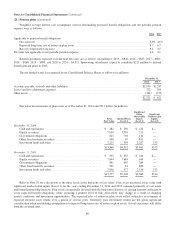
The net funded status is recognized in our Consolidated Balance Sheets as follows (in millions).
December 31,
2014 2013
Accounts payable, accruals and other liabilities .................................................. $2,550 $1,287
Losses and loss adjustment expenses .......................................................... 332 309
Other assets .............................................................................. (361) (975)
$2,521 $ 621
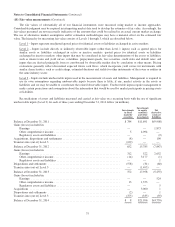
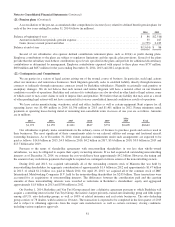
Fair value measurements of plan assets as of December 31, 2014 and 2013 follow (in millions).
Total
Fair Value
Quoted Prices
(Level 1)
Significant
Other
Observable
Inputs
(Level 2)
Significant
Unobservable
Inputs
(Level 3)
December 31, 2014
Cash and equivalents ....................................... $ 482 $ 250 $ 232 $—
Equity securities ........................................... 7,950 7,739 211 —
Government obligations ..................................... 811 701 110 —
Other fixed maturity securities ................................ 908 67 841 —
Investment funds and other ................................... 3,215 595 2,287 333
$13,366 $9,352 $3,681 $333
December 31, 2013
Cash and equivalents ....................................... $ 595 $ 355 $ 240 $—
Equity securities ........................................... 7,844 7,684 160 —
Government obligations ..................................... 891 607 284 —
Other fixed maturity securities ................................ 901 81 820 —
Investment funds and other ................................... 3,046 577 2,156 313
$13,277 $9,304 $3,660 $313
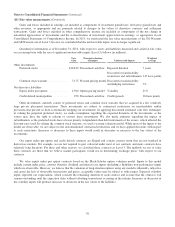
Refer to Note 18 for a discussion of the three levels in the hierarchy of fair values. Plan assets measured at fair value with
significant unobservable inputs (Level 3) for the years ending December 31, 2014 and 2013 consisted primarily of real estate
and limited partnership interests. Plan assets are generally invested with the long-term objective of earning amounts sufficient to
cover expected benefit obligations, while assuming a prudent level of risk. Allocations may change as a result of changing
market conditions and investment opportunities. The expected rates of return on plan assets reflect subjective assessments of
expected invested asset returns over a period of several years. Generally, past investment returns are not given significant
consideration when establishing assumptions for expected long-term rates of return on plan assets. Actual experience will differ
from the assumed rates.
80