Berkshire Hathaway 2014 Annual Report Download - page 103
Download and view the complete annual report
Please find page 103 of the 2014 Berkshire Hathaway annual report below. You can navigate through the pages in the report by either clicking on the pages listed below, or by using the keyword search tool below to find specific information within the annual report.-
 1
1 -
2
-
3
-
4
-
5
-
6
-
7
-
8
-
9
-
10
-
11
-
12
-
13
-
14
-
15
-
16
-
17
-
18
-
19
-
20
-
21
-
22
-
23
-
24
-
25
-
26
-
27
-
28
-
29
-
30
-
31
-
32
-
33
-
34
-
35
-
36
-
37
-
38
-
39
-
40
-
41
-
42
-
43
-
44
-
45
-
46
-
47
-
48
-
49
-
50
-
51
-
52
-
53
-
54
-
55
-
56
-
57
-
58
-
59
-
60
-
61
-
62
-
63
-
64
-
65
-
66
-
67
-
68
-
69
-
70
-
71
-
72
-
73
-
74
-
75
-
76
-
77
-
78
-
79
-
80
-
81
-
82
-
83
-
84
-
85
-
86
-
87
-
88
-
89
-
90
-
91
-
92
-
 93
93 -
 94
94 -
 95
95 -
 96
96 -
 97
97 -
 98
98 -
 99
99 -
 100
100 -
 101
101 -
 102
102 -
 103
103 -
 104
104 -
 105
105 -
 106
106 -
 107
107 -
 108
108 -
 109
109 -
 110
110 -
 111
111 -
 112
112 -
 113
113 -
114
-
115
-
116
-
117
-
118
-
119
-
120
-
121
-
122
-
123
-
124
-
125
-
126
-
127
-
128
-
129
-
130
-
131
-
132
-
133
-
134
-
135
-
136
-
137
-
138
-
139
-
140
-
141
-
142
-
143
-
144
-
145
-
146
-
147
-
148
 |
 |

Management’s Discussion (Continued)
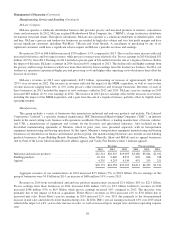
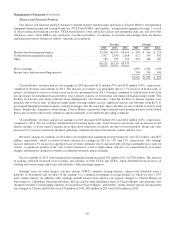
Finance and Financial Products
Our finance and financial products businesses include manufactured housing and finance (Clayton Homes), transportation
equipment manufacturing and leasing businesses (UTLX and XTRA, and together, “transportation equipment leasing”), as well
as other leasing and financing activities. UTLX manufactures, owns and leases railcars and intermodal tank cars, and also owns
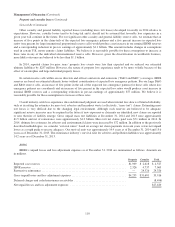
and leases cranes, while XTRA owns and leases over-the-road trailers. A summary of revenues and earnings from our finance
and financial products businesses follows. Amounts are in millions.
Revenues Earnings
2014 2013 2012 2014 2013 2012
Manufactured housing and finance .............................. $3,310 $3,199 $3,014 $ 558 $ 416 $ 255
Transportation equipment leasing ............................... 2,427 2,180 2,168 827 704 651
Other ..................................................... 789 731 751 454 444 487
$6,526 $6,110 $5,933
Pre-tax earnings ............................................. 1,839 1,564 1,393
Income taxes and noncontrolling interests ........................ 596 556 494
$1,243 $1,008 $ 899
Clayton Homes’ revenues and pre-tax earnings in 2014 increased $111 million (3%) and $142 million (34%), respectively,
compared to revenues and earnings in 2013. The increase in revenues was principally due to a 7% increase in homes sold, as
interest and financial services revenues were relatively unchanged from 2013. Earnings continued to benefit from lower loan
loss provisions on installment loan portfolios, lower interest expense on borrowings and improved manufacturing results. The
declines in loan loss provisions reflected fewer delinquencies and foreclosures, while the declines in interest expense were
primarily due to lower rates. Traditional single family housing markets receive significant interest rate subsidies from the U.S.
government through government agency insured mortgages. For the most part, these subsidies are not available to factory built
homes. Despite this competitive disadvantage, Clayton Homes remains the largest manufactured housing business in the United
States and we believe that it will continue to operate profitably, even under the prevailing conditions.
Clayton Homes’ revenues and pre-tax earnings in 2013 increased $185 million (6%) and $161 million (63%), respectively,
compared to 2012. Pre-tax earnings benefitted from increased home sales, lower loan loss provisions and an increase in net
interest income, as lower interest expense more than offset reductions in interest income on loan portfolios. Home unit sales
increased 9%. Loan loss provisions declined, reflecting comparatively lower foreclosures volume and loss rates.
Revenues and pre-tax earnings in 2014 from our transportation equipment leasing businesses were $2.4 billion, and $827
million, respectively, which exceeded revenues and pre-tax earnings in 2013 by 11% and 17%, respectively. The earnings
increase reflected a 9% increase in aggregate lease revenues, primarily due to increased units on lease and higher lease rates for
railcars. A significant portion of the costs of these businesses, such as depreciation, will not vary proportionately to revenue
changes and therefore changes in revenues can disproportionately impact earnings.
Pre-tax earnings in 2013 from transportation equipment leasing increased $53 million (8%) to $704 million. The increase
in earnings reflected increased lease revenues and earnings of both UTLX and XTRA, which benefitted from increases in
working units and average rental rates and relatively stable operating expenses.
Earnings from our other finance activities include CORT’s furniture leasing business, interest and dividends from a
portfolio of investments and our share of the earnings of a commercial mortgage servicing business in which we own a 50%
joint venture interest. In addition, other earnings include income from interest rate spreads charged to Clayton Homes on
borrowings by a Berkshire financing subsidiary that are used to fund installment loans of Clayton Homes and guarantee fees
charged to NetJets. Corresponding expenses are included in Clayton Homes’ and NetJets’ results. Interest spreads and guarantee
fees charged to Clayton and NetJets were $70 million in 2014, $89 million in 2013 and $120 million in 2012.
101