Berkshire Hathaway 2014 Annual Report Download - page 117
Download and view the complete annual report
Please find page 117 of the 2014 Berkshire Hathaway annual report below. You can navigate through the pages in the report by either clicking on the pages listed below, or by using the keyword search tool below to find specific information within the annual report.-
 1
1 -
2
-
3
-
4
-
5
-
6
-
7
-
8
-
9
-
10
-
11
-
12
-
13
-
14
-
15
-
16
-
17
-
18
-
19
-
20
-
21
-
22
-
23
-
24
-
25
-
26
-
27
-
28
-
29
-
30
-
31
-
32
-
33
-
34
-
35
-
36
-
37
-
38
-
39
-
40
-
41
-
42
-
43
-
44
-
45
-
46
-
47
-
48
-
49
-
50
-
51
-
52
-
53
-
54
-
55
-
56
-
57
-
58
-
59
-
60
-
61
-
62
-
63
-
64
-
65
-
66
-
67
-
68
-
69
-
70
-
71
-
72
-
73
-
74
-
75
-
76
-
77
-
78
-
79
-
80
-
81
-
82
-
83
-
84
-
85
-
86
-
87
-
88
-
89
-
90
-
91
-
92
-
93
-
94
-
95
-
96
-
97
-
98
-
99
-
100
-
101
-
102
-
103
-
104
-
105
-
106
-
 107
107 -
 108
108 -
 109
109 -
 110
110 -
 111
111 -
 112
112 -
 113
113 -
 114
114 -
 115
115 -
 116
116 -
 117
117 -
 118
118 -
 119
119 -
 120
120 -
 121
121 -
 122
122 -
 123
123 -
 124
124 -
 125
125 -
 126
126 -
 127
127 -
128
-
129
-
130
-
131
-
132
-
133
-
134
-
135
-
136
-
137
-
138
-
139
-
140
-
141
-
142
-
143
-
144
-
145
-
146
-
147
-
148
 |
 |

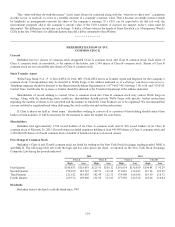
Management’s Discussion (Continued)
Equity Price Risk (Continued)
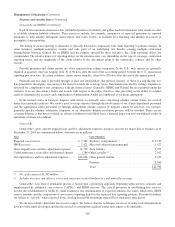
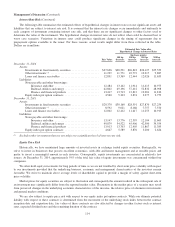
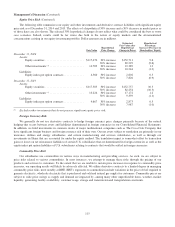
The following table summarizes our equity and other investments and derivative contract liabilities with significant equity
price risk as of December 31, 2014 and 2013. The effects of a hypothetical 30% increase and a 30% decrease in market prices as
of those dates are also shown. The selected 30% hypothetical changes do not reflect what could be considered the best or worst
case scenarios. Indeed, results could be far worse due both to the nature of equity markets and the aforementioned
concentrations existing in our equity investment portfolio. Dollar amounts are in millions.
Fair Value
Hypothetical
Price Change
Estimated
Fair Value after
Hypothetical
Change in Prices
Hypothetical
Percentage
Increase (Decrease) in
Shareholders’ Equity
December 31, 2014
Assets:
Equity securities ........................... $117,470 30% increase $152,711 9.6
30% decrease 82,229 (9.6)
Other investments (1) ........................ 14,789 30% increase 19,389 1.2
30% decrease 10,244 (1.2)
Liabilities:
Equity index put option contracts .............. 4,560 30% increase 2,802 0.5
30% decrease 7,826 (0.9)
December 31, 2013
Assets:
Equity securities ........................... $117,505 30% increase $152,757 10.3
30% decrease 82,254 (10.3)
Other investments (1) ........................ 13,226 30% increase 17,172 1.2
30% decrease 9,359 (1.1)
Liabilities:
Equity index put option contracts .............. 4,667 30% increase 2,873 0.5
30% decrease 7,987 (1.0)
(1) Excludes other investments that do not possess significant equity price risk.
Foreign Currency Risk
We generally do not use derivative contracts to hedge foreign currency price changes primarily because of the natural
hedging that occurs between assets and liabilities denominated in foreign currencies in our Consolidated Financial Statements.
In addition, we hold investments in common stocks of major multinational companies such as The Coca-Cola Company that
have significant foreign business and foreign currency risk of their own. Our net assets subject to translation are primarily in our
insurance, utilities and energy subsidiaries, and certain manufacturing and services subsidiaries, as well as through our
investments in Heinz that are accounted for under the equity method. The translation impact is somewhat offset by transaction
gains or losses on net reinsurance liabilities of certain U.S. subsidiaries that are denominated in foreign currencies as well as the
equity index put option liabilities of U.S. subsidiaries relating to contracts that would be settled in foreign currencies.
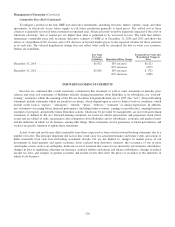
Commodity Price Risk
Our subsidiaries use commodities in various ways in manufacturing and providing services. As such, we are subject to
price risks related to various commodities. In most instances, we attempt to manage these risks through the pricing of our
products and services to customers. To the extent that we are unable to sustain price increases in response to commodity price
increases, our operating results will likely be adversely affected. We utilize derivative contracts to a limited degree in managing
commodity price risks, most notably at BHE. BHE’s exposures to commodities include variations in the price of fuel required to
generate electricity, wholesale electricity that is purchased and sold and natural gas supply for customers. Commodity prices are
subject to wide price swings as supply and demand are impacted by, among many other unpredictable items, weather, market
liquidity, generating facility availability, customer usage, storage and transmission and transportation constraints.
115