Berkshire Hathaway 2014 Annual Report Download - page 69
Download and view the complete annual report
Please find page 69 of the 2014 Berkshire Hathaway annual report below. You can navigate through the pages in the report by either clicking on the pages listed below, or by using the keyword search tool below to find specific information within the annual report.-
 1
1 -
2
-
3
-
4
-
5
-
6
-
7
-
8
-
9
-
10
-
11
-
12
-
13
-
14
-
15
-
16
-
17
-
18
-
19
-
20
-
21
-
22
-
23
-
24
-
25
-
26
-
27
-
28
-
29
-
30
-
31
-
32
-
33
-
34
-
35
-
36
-
37
-
38
-
39
-
40
-
41
-
42
-
43
-
44
-
45
-
46
-
47
-
48
-
49
-
50
-
51
-
52
-
53
-
54
-
55
-
56
-
57
-
58
-
 59
59 -
 60
60 -
 61
61 -
 62
62 -
 63
63 -
 64
64 -
 65
65 -
 66
66 -
 67
67 -
 68
68 -
 69
69 -
 70
70 -
 71
71 -
 72
72 -
 73
73 -
 74
74 -
 75
75 -
 76
76 -
 77
77 -
 78
78 -
 79
79 -
80
-
81
-
82
-
83
-
84
-
85
-
86
-
87
-
88
-
89
-
90
-
91
-
92
-
93
-
94
-
95
-
96
-
97
-
98
-
99
-
100
-
101
-
102
-
103
-
104
-
105
-
106
-
107
-
108
-
109
-
110
-
111
-
112
-
113
-
114
-
115
-
116
-
117
-
118
-
119
-
120
-
121
-
122
-
123
-
124
-
125
-
126
-
127
-
128
-
129
-
130
-
131
-
132
-
133
-
134
-
135
-
136
-
137
-
138
-
139
-
140
-
141
-
142
-
143
-
144
-
145
-
146
-
147
-
148
 |
 |
Notes to Consolidated Financial Statements (Continued)
(11) Goodwill and other intangible assets (Continued)
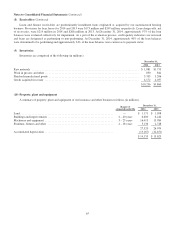
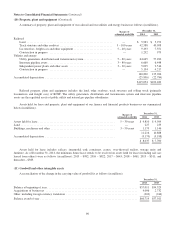
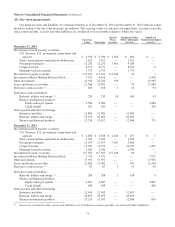
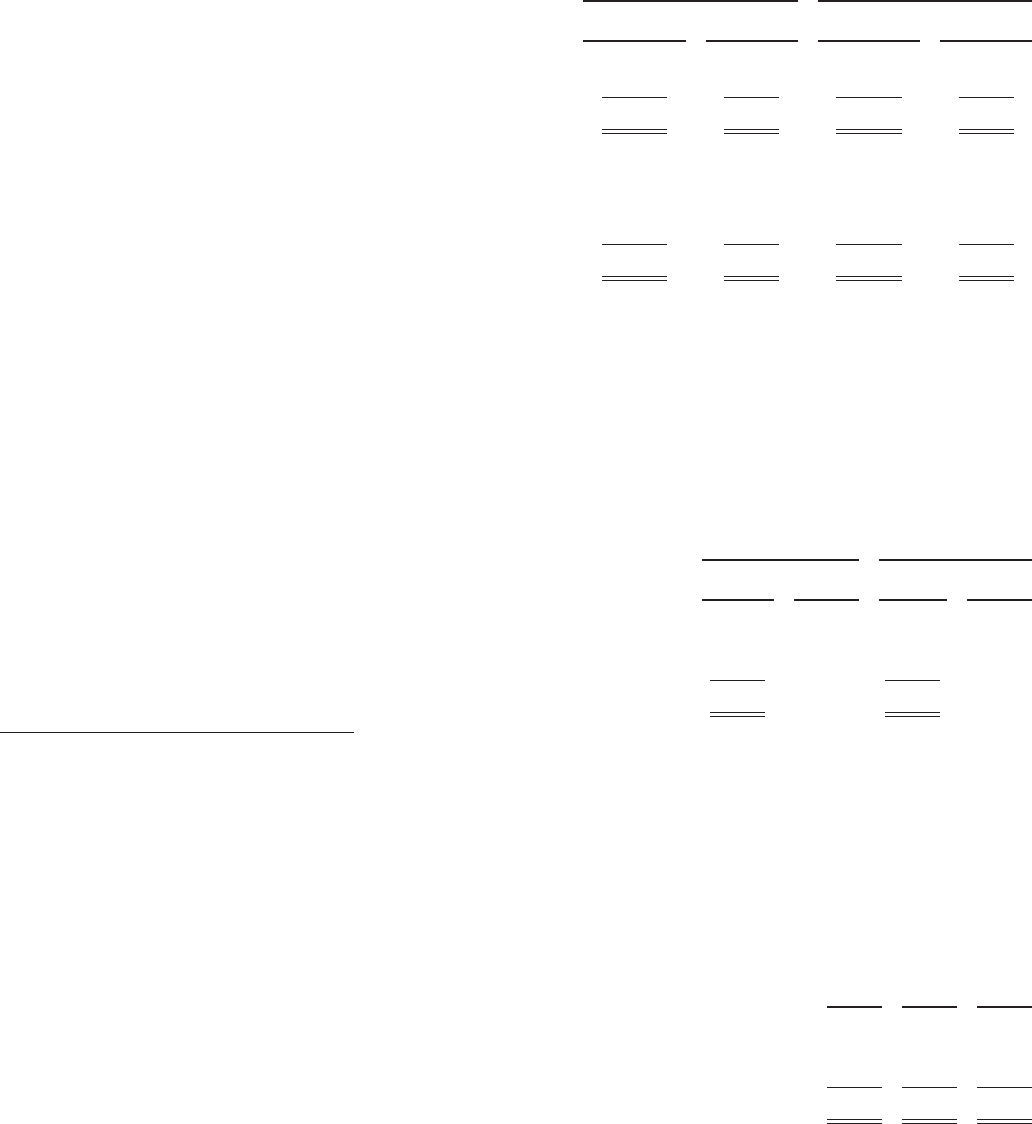
Intangible assets other than goodwill are included in other assets and are summarized as follows (in millions).
December 31, 2014 December 31, 2013
Gross carrying
amount
Accumulated
amortization
Gross carrying
amount
Accumulated
amortization
Insurance and other ........................................ $13,714 $4,476 $11,923 $3,723
Railroad, utilities and energy ................................. 2,254 1,551 2,214 1,231
$15,968 $6,027 $14,137 $4,954
Trademarks and trade names ................................. $ 3,117 $ 599 $ 2,750 $ 340
Patents and technology ..................................... 5,425 3,133 5,173 2,626
Customer relationships ..................................... 5,603 1,768 4,690 1,518
Other ................................................... 1,823 527 1,524 470
$15,968 $6,027 $14,137 $4,954
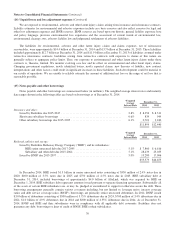
Amortization expense was $1,155 million in 2014, $1,090 million in 2013 and $1,008 million in 2012. Estimated
amortization expense over the next five years is as follows (in millions): 2015 – $927; 2016 – $870; 2017 – $856, 2018 – $759
and 2019 – $684. Intangible assets with indefinite lives as of December 31, 2014 and 2013 were $2,586 million and
$2,221 million, respectively.
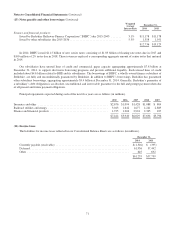
(12) Derivative contracts
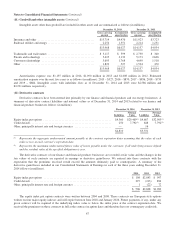
Derivative contracts have been entered into primarily by our finance and financial products and our energy businesses. A
summary of derivative contract liabilities and notional values as of December 31, 2014 and 2013 related to our finance and
financial products businesses follows (in millions).
December 31, 2014 December 31, 2013
Liabilities
Notional
Value Liabilities
Notional
Value
Equity index put options ................................................ $4,560 $29,469(1) $4,667 $32,095(1)
Credit default ......................................................... 250 7,792(2) 648 7,792(2)
Other, principally interest rate and foreign currency .......................... — 16
$4,810 $5,331
(1) Represents the aggregate undiscounted amount payable at the contract expiration dates assuming that the value of each
index is zero at each contract’s expiration date.
(2) Represents the maximum undiscounted future value of losses payable under the contracts, if all underlying issuers default
and the residual value of the specified obligations is zero.
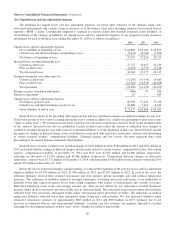
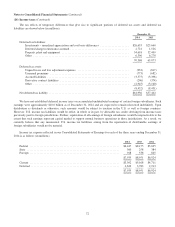
The derivative contracts of our finance and financial products businesses are recorded at fair value and the changes in the
fair values of such contracts are reported in earnings as derivative gains/losses. We entered into these contracts with the
expectation that the premiums received would exceed the amounts ultimately paid to counterparties. A summary of the
derivative gains/losses included in our Consolidated Statements of Earnings in each of the three years ending December 31,
2014 follows (in millions).
2014 2013 2012
Equity index put options ............................................................ $ 108 $2,843 $ 997
Credit default ..................................................................... 397 (213) 894
Other, principally interest rate and foreign currency ....................................... 1 (22) 72
$ 506 $2,608 $1,963
The equity index put option contracts were written between 2004 and 2008. These contracts are European style options
written on four major equity indexes and will expire between June 2018 and January 2026. Future payments, if any, under any
given contract will be required if the underlying index value is below the strike price at the contract expiration date. We
received the premiums on these contracts in full at the contract inception dates and therefore have no counterparty credit risk.
67