Berkshire Hathaway 2014 Annual Report Download - page 62
Download and view the complete annual report
Please find page 62 of the 2014 Berkshire Hathaway annual report below. You can navigate through the pages in the report by either clicking on the pages listed below, or by using the keyword search tool below to find specific information within the annual report.-
 1
1 -
2
-
3
-
4
-
5
-
6
-
7
-
8
-
9
-
10
-
11
-
12
-
13
-
14
-
15
-
16
-
17
-
18
-
19
-
20
-
21
-
22
-
23
-
24
-
25
-
26
-
27
-
28
-
29
-
30
-
31
-
32
-
33
-
34
-
35
-
36
-
37
-
38
-
39
-
40
-
41
-
42
-
43
-
44
-
45
-
46
-
47
-
48
-
49
-
50
-
51
-
 52
52 -
 53
53 -
 54
54 -
 55
55 -
 56
56 -
 57
57 -
 58
58 -
 59
59 -
 60
60 -
 61
61 -
 62
62 -
 63
63 -
 64
64 -
 65
65 -
 66
66 -
 67
67 -
 68
68 -
 69
69 -
 70
70 -
 71
71 -
 72
72 -
73
-
74
-
75
-
76
-
77
-
78
-
79
-
80
-
81
-
82
-
83
-
84
-
85
-
86
-
87
-
88
-
89
-
90
-
91
-
92
-
93
-
94
-
95
-
96
-
97
-
98
-
99
-
100
-
101
-
102
-
103
-
104
-
105
-
106
-
107
-
108
-
109
-
110
-
111
-
112
-
113
-
114
-
115
-
116
-
117
-
118
-
119
-
120
-
121
-
122
-
123
-
124
-
125
-
126
-
127
-
128
-
129
-
130
-
131
-
132
-
133
-
134
-
135
-
136
-
137
-
138
-
139
-
140
-
141
-
142
-
143
-
144
-
145
-
146
-
147
-
148
 |
 |

Notes to Consolidated Financial Statements (Continued)
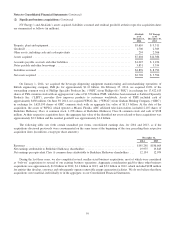
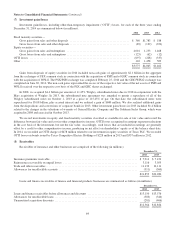
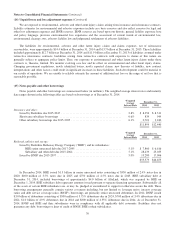
(3) Investments in fixed maturity securities
Investments in securities with fixed maturities as of December 31, 2014 and 2013 are summarized by type below
(in millions).
Amortized
Cost
Unrealized
Gains
Unrealized
Losses
Fair
Value
December 31, 2014
U.S. Treasury, U.S. government corporations and agencies ............... $ 2,921 $ 14 $ (5) $ 2,930
States, municipalities and political subdivisions ........................ 1,820 93 (1) 1,912
Foreign governments ............................................. 12,023 373 (126) 12,270
Corporate bonds ................................................. 7,704 1,072 (5) 8,771
Mortgage-backed securities ........................................ 1,555 202 (4) 1,753
$26,023 $1,754 $(141) $27,636
December 31, 2013
U.S. Treasury, U.S. government corporations and agencies ............... $ 2,650 $ 16 $ (8) $ 2,658
States, municipalities and political subdivisions ........................ 2,221 129 (5) 2,345
Foreign governments ............................................. 11,001 182 (110) 11,073
Corporate bonds ................................................. 10,062 1,190 (15) 11,237
Mortgage-backed securities ........................................ 1,830 218 (8) 2,040
$27,764 $1,735 $(146) $29,353
Investments in fixed maturity securities are reflected in our Consolidated Balance Sheets as follows (in millions).
December 31,
2014 2013
Insurance and other ............................................................ $27,397 $28,785
Finance and financial products ................................................... 239 568
$27,636 $29,353
Investments in foreign government securities include securities issued by national and provincial government entities as
well as instruments that are unconditionally guaranteed by such entities. As of December 31, 2014, approximately 93% of
foreign government holdings were rated AA or higher by at least one of the major rating agencies. Approximately 77% of
foreign government holdings were issued or guaranteed by the United Kingdom, Germany, Australia, Canada or The
Netherlands. Unrealized losses on all fixed maturity investments in a continuous unrealized loss position for more than twelve
consecutive months were $15 million as of December 31, 2014 and $26 million as of December 31, 2013.
60