Berkshire Hathaway 2014 Annual Report Download - page 71
Download and view the complete annual report
Please find page 71 of the 2014 Berkshire Hathaway annual report below. You can navigate through the pages in the report by either clicking on the pages listed below, or by using the keyword search tool below to find specific information within the annual report.-
 1
1 -
2
-
3
-
4
-
5
-
6
-
7
-
8
-
9
-
10
-
11
-
12
-
13
-
14
-
15
-
16
-
17
-
18
-
19
-
20
-
21
-
22
-
23
-
24
-
25
-
26
-
27
-
28
-
29
-
30
-
31
-
32
-
33
-
34
-
35
-
36
-
37
-
38
-
39
-
40
-
41
-
42
-
43
-
44
-
45
-
46
-
47
-
48
-
49
-
50
-
51
-
52
-
53
-
54
-
55
-
56
-
57
-
58
-
59
-
60
-
 61
61 -
 62
62 -
 63
63 -
 64
64 -
 65
65 -
 66
66 -
 67
67 -
 68
68 -
 69
69 -
 70
70 -
 71
71 -
 72
72 -
 73
73 -
 74
74 -
 75
75 -
 76
76 -
 77
77 -
 78
78 -
 79
79 -
 80
80 -
 81
81 -
82
-
83
-
84
-
85
-
86
-
87
-
88
-
89
-
90
-
91
-
92
-
93
-
94
-
95
-
96
-
97
-
98
-
99
-
100
-
101
-
102
-
103
-
104
-
105
-
106
-
107
-
108
-
109
-
110
-
111
-
112
-
113
-
114
-
115
-
116
-
117
-
118
-
119
-
120
-
121
-
122
-
123
-
124
-
125
-
126
-
127
-
128
-
129
-
130
-
131
-
132
-
133
-
134
-
135
-
136
-
137
-
138
-
139
-
140
-
141
-
142
-
143
-
144
-
145
-
146
-
147
-
148
 |
 |

Notes to Consolidated Financial Statements (Continued)
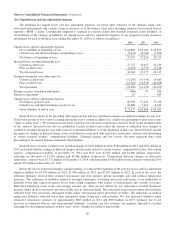
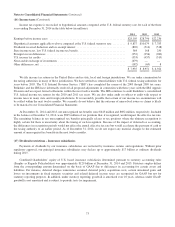
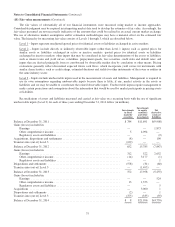
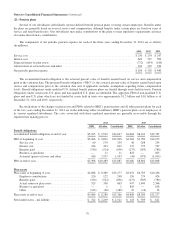
(14) Unpaid losses and loss adjustment expenses
The liabilities for unpaid losses and loss adjustment expenses are based upon estimates of the ultimate claim costs
associated with property and casualty claim occurrences as of the balance sheet dates including estimates for incurred but not
reported (“IBNR”) claims. Considerable judgment is required to evaluate claims and establish estimated claim liabilities. A
reconciliation of the changes in liabilities for unpaid losses and loss adjustment expenses of our property/casualty insurance
subsidiaries for each of the three years ending December 31, 2014 is as follows (in millions).
2014 2013 2012
Unpaid losses and loss adjustment expenses:
Gross liabilities at beginning of year .......................................... $64,866 $ 64,160 $ 63,819
Ceded losses and deferred charges at beginning of year ........................... (7,414) (6,944) (7,092)
Net balance at beginning of year ............................................. 57,452 57,216 56,727
Incurred losses recorded during the year:
Current accident year ...................................................... 27,771 23,027 22,239
Prior accident years ....................................................... (1,365) (1,752) (2,126)
Total incurred losses ...................................................... 26,406 21,275 20,113
Payments during the year with respect to:
Current accident year ...................................................... (11,289) (10,154) (9,667)
Prior accident years ....................................................... (11,381) (10,978) (10,628)
Total payments ........................................................... (22,670) (21,132) (20,295)
Foreign currency translation adjustment ........................................... (666) 93 186
Business acquisitions .......................................................... 67 — 485
Unpaid losses and loss adjustment expenses:
Net balance at end of year .................................................. 60,589 57,452 57,216
Ceded losses and deferred charges at end of year ................................ 10,888 7,414 6,944
Gross liabilities at end of year ............................................... $71,477 $ 64,866 $ 64,160
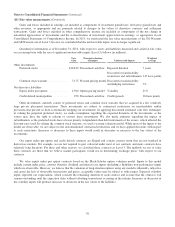
Incurred losses shown in the preceding table represent loss and loss adjustment expenses recorded in earnings in each year.
Such losses pertain to loss events occurring during the year (“current accident year”) and losses pertaining to prior year events
(“prior accident years”). We present incurred losses related to our retroactive reinsurance contracts based on the inception dates
of the contracts. Incurred losses that are attributable to prior accident years reflect the amount of estimation error charged or
credited to earnings during the year with respect to estimated liabilities as of the beginning of that year. Incurred losses include
the impact of changes in deferred charge assets established in connection with retroactive reinsurance contracts and discounting
of certain assumed workers’ compensation liabilities. Deferred charges and loss reserve discounts represent time value
discounting of the related ultimate estimated claim liabilities.
Incurred losses for prior accident years included charges of $128 million in 2014, $186 million in 2013 and $381 million in
2012 associated with the changes in deferred charges and discounts related to certain workers’ compensation claims. Discounted
workers’ compensation liabilities at December 31, 2014 and 2013 were $2,035 million and $2,066 million, respectively,
reflecting net discounts of $1,745 million and $1,866 million, respectively. Unamortized deferred charges on retroactive
reinsurance contracts were $7,772 million at December 31, 2014, which included $3,428 million from contracts written in 2014,
and $4,359 million at December 31, 2013.
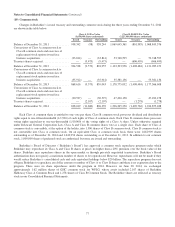
Before the effects of deferred charges and discounting, we reduced the beginning of the year net losses and loss adjustment
expenses liability by $1,493 million in 2014, $1,938 million in 2013 and $2,507 million in 2012. In each of the years, the
reduction primarily derived from assumed reinsurance and from primary private passenger auto and medical malpractice
insurance. The reductions in liabilities related to assumed reinsurance, excluding retroactive reinsurance, were attributable to
generally lower than expected reported losses from ceding companies with respect to both property and casualty coverages.
Individual underlying claim counts and average amounts per claim are not utilized by our reinsurance assumed businesses
because clients do not consistently provide reliable data in sufficient detail. The reductions in private passenger auto liabilities
reflected lower than previously anticipated bodily injury and personal injury protection severities. The reductions in medical
malpractice liabilities reflected lower than anticipated claims frequencies and severities. We also increased liabilities under
retroactive reinsurance contracts by approximately $825 million in 2014 and $300 million in 2013, primarily due to net
increases in estimated asbestos and environmental liabilities. Accident year loss estimates are regularly adjusted to consider
emerging loss development patterns of prior years’ losses, whether favorable or unfavorable.
69