Berkshire Hathaway 2014 Annual Report Download - page 92
Download and view the complete annual report
Please find page 92 of the 2014 Berkshire Hathaway annual report below. You can navigate through the pages in the report by either clicking on the pages listed below, or by using the keyword search tool below to find specific information within the annual report.-
 1
1 -
2
-
3
-
4
-
5
-
6
-
7
-
8
-
9
-
10
-
11
-
12
-
13
-
14
-
15
-
16
-
17
-
18
-
19
-
20
-
21
-
22
-
23
-
24
-
25
-
26
-
27
-
28
-
29
-
30
-
31
-
32
-
33
-
34
-
35
-
36
-
37
-
38
-
39
-
40
-
41
-
42
-
43
-
44
-
45
-
46
-
47
-
48
-
49
-
50
-
51
-
52
-
53
-
54
-
55
-
56
-
57
-
58
-
59
-
60
-
61
-
62
-
63
-
64
-
65
-
66
-
67
-
68
-
69
-
70
-
71
-
72
-
73
-
74
-
75
-
76
-
77
-
78
-
79
-
80
-
81
-
 82
82 -
 83
83 -
 84
84 -
 85
85 -
 86
86 -
 87
87 -
 88
88 -
 89
89 -
 90
90 -
 91
91 -
 92
92 -
 93
93 -
 94
94 -
 95
95 -
 96
96 -
 97
97 -
 98
98 -
 99
99 -
 100
100 -
 101
101 -
 102
102 -
103
-
104
-
105
-
106
-
107
-
108
-
109
-
110
-
111
-
112
-
113
-
114
-
115
-
116
-
117
-
118
-
119
-
120
-
121
-
122
-
123
-
124
-
125
-
126
-
127
-
128
-
129
-
130
-
131
-
132
-
133
-
134
-
135
-
136
-
137
-
138
-
139
-
140
-
141
-
142
-
143
-
144
-
145
-
146
-
147
-
148
 |
 |

Management’s Discussion (Continued)
Insurance—Underwriting (Continued)
General Re (Continued)
Life/health
Premiums written and earned in 2014 increased $170 million (5.7%) and $184 million (6.2%), respectively, compared to
2013. Adjusting for changes in foreign currency exchange rates, premiums written in 2014 increased $217 million (7.3%) over
2013 and premiums earned were $234 million (7.9%) higher than 2013. These increases primarily derived from life business
across a number of non-U.S. markets. Premiums written in 2013 decreased $11 million (0.4%), while premiums earned
increased $11 million (0.4%) compared with 2012. Adjusting for the effects of currency exchange rate changes, premiums
written in 2013 increased $9 million (0.3%) over 2012 and premiums earned in 2013 were $32 million (1.1%) greater than
2012. The increases were primarily attributable to increased non-U.S. life business.
Our life/health operations produced pre-tax underwriting gains of $107 million in 2014 compared to $135 million in 2013. In
2014, we increased reserves by approximately $50 million as a result of reducing discount rates for certain European long-term care
and disability business. In 2014, we also experienced increased frequency and severity of claims in Australian disability business.
Life/health pre-tax underwriting gains in 2013 were driven by lower than expected mortality. Underwriting results for 2012
were negatively impacted by a premium deficiency reserve that was established on the run-off of the U.S. long-term care
business as well as greater than expected claims on Australian disability business. Underwriting results in all three years also
reflected charges attributable to the periodic discount accretion on U.S. long-term care liabilities.
Berkshire Hathaway Reinsurance Group
Through BHRG, we underwrite excess-of-loss reinsurance and quota-share coverages on property and casualty risks for
insurers and reinsurers worldwide, including property catastrophe insurance and reinsurance. The timing and magnitude of
catastrophe losses can produce extraordinary volatility in the periodic underwriting results. BHRG also writes retroactive
reinsurance, which provides indemnification of losses and loss adjustment expenses with respect to past loss events arising
under property/casualty coverages. BHRG’s underwriting activities also include life reinsurance and annuity businesses.
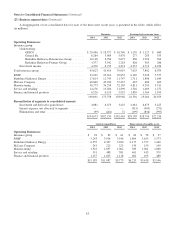
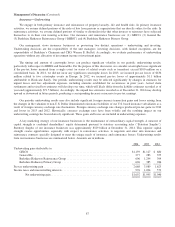
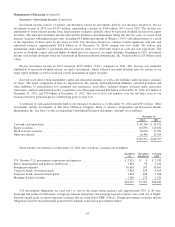
BHRG’s underwriting results are summarized in the table below. Amounts are in millions.
Premiums earned Pre-tax underwriting gain/loss
2014 2013 2012 2014 2013 2012
Property/casualty ........................................ $ 4,064 $5,149 $6,122 $1,684 $1,236 $ 695
Retroactive reinsurance ................................... 3,371 328 717 (905) (321) (201)
Life and annuity ......................................... 2,681 3,309 2,833 (173) 379 (190)
$10,116 $8,786 $9,672 $ 606 $1,294 $ 304
Property/casualty
Premiums earned in 2014 were $4,064 million, a decline of $1,085 million (21%) compared to 2013. Premiums earned in
2014 with respect to a 20% quota-share contract with Swiss Reinsurance Company Ltd. (“Swiss Re”) declined $1.3 billion from
premiums earned in 2013. This contract expired at the end of 2012 and is in run-off. Property catastrophe premiums earned in
2014 were $688 million, a decline of $113 million (14%) as compared to 2013. Our volume with respect to these coverages
continues to be constrained, as rates, in our view, are inadequate. However, we have the capacity and desire to write
substantially more business when appropriate pricing can be obtained. These declines were partially offset by increased
premiums earned from property quota-share contracts.
The property/casualty business generated pre-tax underwriting gains of $1.7 billion in 2014 compared to $1.2 billion in
2013. There were no losses from significant catastrophe events during 2014. Our property business, including property
catastrophe business, generated pre-tax underwriting gains of approximately $700 million in 2014 compared to underwriting
gains of about $800 million in 2013. The Swiss Re quota-share contract produced pre-tax underwriting gains of $283 million in
2014 and $351 million in 2013, primarily attributable to reductions in estimates of ultimate liabilities for prior years’ losses.
BHRG’s underwriting results can be significantly impacted by foreign currency transaction gains or losses associated with
certain reinsurance liabilities of U.S.-based subsidiaries (primarily arising under retroactive reinsurance contracts), which are
denominated in foreign currencies. Underwriting results included foreign currency exchange rate gains of $315 million in 2014
compared to losses of $28 million in 2013.
90