Berkshire Hathaway 2014 Annual Report Download - page 17
Download and view the complete annual report
Please find page 17 of the 2014 Berkshire Hathaway annual report below. You can navigate through the pages in the report by either clicking on the pages listed below, or by using the keyword search tool below to find specific information within the annual report.-
 1
1 -
2
-
3
-
4
-
5
-
6
-
 7
7 -
 8
8 -
 9
9 -
 10
10 -
 11
11 -
 12
12 -
 13
13 -
 14
14 -
 15
15 -
 16
16 -
 17
17 -
 18
18 -
 19
19 -
 20
20 -
 21
21 -
 22
22 -
 23
23 -
 24
24 -
 25
25 -
 26
26 -
 27
27 -
28
-
29
-
30
-
31
-
32
-
33
-
34
-
35
-
36
-
37
-
38
-
39
-
40
-
41
-
42
-
43
-
44
-
45
-
46
-
47
-
48
-
49
-
50
-
51
-
52
-
53
-
54
-
55
-
56
-
57
-
58
-
59
-
60
-
61
-
62
-
63
-
64
-
65
-
66
-
67
-
68
-
69
-
70
-
71
-
72
-
73
-
74
-
75
-
76
-
77
-
78
-
79
-
80
-
81
-
82
-
83
-
84
-
85
-
86
-
87
-
88
-
89
-
90
-
91
-
92
-
93
-
94
-
95
-
96
-
97
-
98
-
99
-
100
-
101
-
102
-
103
-
104
-
105
-
106
-
107
-
108
-
109
-
110
-
111
-
112
-
113
-
114
-
115
-
116
-
117
-
118
-
119
-
120
-
121
-
122
-
123
-
124
-
125
-
126
-
127
-
128
-
129
-
130
-
131
-
132
-
133
-
134
-
135
-
136
-
137
-
138
-
139
-
140
-
141
-
142
-
143
-
144
-
145
-
146
-
147
-
148
 |
 |
In the GAAP-compliant figures we show on page 49, amortization charges of $1.15 billion have been
deducted as expenses. We would call about 20% of these “real,” the rest not. The “non-real” charges, once non-
existent at Berkshire, have become significant because of the many acquisitions we have made. Non-real
amortization charges will almost certainly rise further as we acquire more companies.
The GAAP-compliant table on page 67 gives you the current status of our intangible assets. We now have
$7.4 billion left to amortize, of which $4.1 billion will be charged over the next five years. Eventually, of course,
every dollar of non-real costs becomes entirely charged off. When that happens, reported earnings increase even if
true earnings are flat.
Depreciation charges, we want to emphasize, are different: Every dime of depreciation expense we report
is a real cost. That’s true, moreover, at most other companies. When CEOs tout EBITDA as a valuation guide, wire
them up for a polygraph test.
Our public reports of earnings will, of course, continue to conform to GAAP. To embrace reality, however,
you should remember to add back most of the amortization charges we report.
************
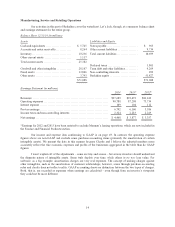
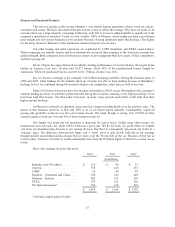
To get back to our many manufacturing, service and retailing operations, they sell products ranging from
lollipops to jet airplanes. Some of this sector’s businesses, measured by earnings on unleveraged net tangible assets,
enjoy terrific economics, producing profits that run from 25% after-tax to far more than 100%. Others generate good
returns in the area of 12% to 20%. A few, however, have very poor returns, the result of some serious mistakes I
made in my job of capital allocation. I was not misled: I simply was wrong in my evaluation of the economic
dynamics of the company or the industry in which it operates.
Fortunately, my blunders normally involved relatively small acquisitions. Our large buys have generally
worked out well and, in a few cases, more than well. I have not, nonetheless, made my last mistake in purchasing
either businesses or stocks. Not everything works out as planned.
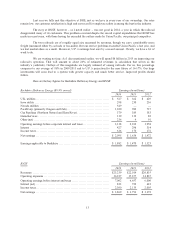
Viewed as a single entity, the companies in this group are an excellent business. They employed an average
of $24 billion of net tangible assets during 2014 and, despite their holding large quantities of excess cash and using
little leverage, earned 18.7% after-tax on that capital.
Of course, a business with terrific economics can be a bad investment if it is bought for too high a price. We
have paid substantial premiums to net tangible assets for most of our businesses, a cost that is reflected in the large
figure we show for goodwill. Overall, however, we are getting a decent return on the capital we have deployed in
this sector. Furthermore, the intrinsic value of these businesses, in aggregate, exceeds their carrying value by a good
margin, and that premium is likely to widen. Even so, the difference between intrinsic value and carrying value in
both the insurance and regulated-industry segments is far greater. It is there that the truly big winners reside.
************
We have far too many companies in this group to comment on them individually. Moreover, their
competitors – both current and potential – read this report. In a few of our businesses we might be disadvantaged if
others knew our numbers. In some of our operations that are not of a size material to an evaluation of Berkshire,
therefore, we only disclose what is required. You can find a good bit of detail about many of our operations,
however, on pages 97-100.
15