Berkshire Hathaway 2014 Annual Report Download - page 18
Download and view the complete annual report
Please find page 18 of the 2014 Berkshire Hathaway annual report below. You can navigate through the pages in the report by either clicking on the pages listed below, or by using the keyword search tool below to find specific information within the annual report.-
 1
1 -
2
-
3
-
4
-
5
-
6
-
7
-
 8
8 -
 9
9 -
 10
10 -
 11
11 -
 12
12 -
 13
13 -
 14
14 -
 15
15 -
 16
16 -
 17
17 -
 18
18 -
 19
19 -
 20
20 -
 21
21 -
 22
22 -
 23
23 -
 24
24 -
 25
25 -
 26
26 -
 27
27 -
 28
28 -
29
-
30
-
31
-
32
-
33
-
34
-
35
-
36
-
37
-
38
-
39
-
40
-
41
-
42
-
43
-
44
-
45
-
46
-
47
-
48
-
49
-
50
-
51
-
52
-
53
-
54
-
55
-
56
-
57
-
58
-
59
-
60
-
61
-
62
-
63
-
64
-
65
-
66
-
67
-
68
-
69
-
70
-
71
-
72
-
73
-
74
-
75
-
76
-
77
-
78
-
79
-
80
-
81
-
82
-
83
-
84
-
85
-
86
-
87
-
88
-
89
-
90
-
91
-
92
-
93
-
94
-
95
-
96
-
97
-
98
-
99
-
100
-
101
-
102
-
103
-
104
-
105
-
106
-
107
-
108
-
109
-
110
-
111
-
112
-
113
-
114
-
115
-
116
-
117
-
118
-
119
-
120
-
121
-
122
-
123
-
124
-
125
-
126
-
127
-
128
-
129
-
130
-
131
-
132
-
133
-
134
-
135
-
136
-
137
-
138
-
139
-
140
-
141
-
142
-
143
-
144
-
145
-
146
-
147
-
148
 |
 |

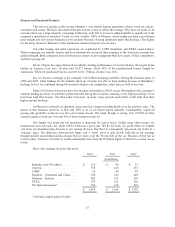
Finance and Financial Products
This year we include in this section Marmon’s very sizable leasing operations, whose wares are railcars,
containers and cranes. We have also restated the previous two years to reflect that change. Why have we made it? At
one time there was a large minority ownership at Marmon, and I felt it was more understandable to include all of the
company’s operations in one place. Today we own virtually 100% of Marmon, which makes me think you will gain
more insight into our various businesses if we include Marmon’s leasing operations under this heading. (The figures
for the many dozens of Marmon’s other businesses remain in the previous section.)
Our other leasing and rental operations are conducted by CORT (furniture) and XTRA (semi-trailers).
These companies are industry leaders and have substantially increased their earnings as the American economy has
gained strength. Both companies have invested more money in new equipment than have many of their competitors,
and that’s paying off.
Kevin Clayton has again delivered an industry-leading performance at Clayton Homes, the largest home
builder in America. Last year, Clayton sold 30,871 homes, about 45% of the manufactured homes bought by
Americans. When we purchased Clayton in 2003 for $1.7 billion, its share was 14%.
Key to Clayton’s earnings is the company’s $13 billion mortgage portfolio. During the financial panic of
2008 and 2009, when funding for the industry dried up, Clayton was able to keep lending because of Berkshire’s
backing. In fact, we continued during that period to finance our competitors’ retail sales as well as our own.
Many of Clayton’s borrowers have low incomes and mediocre FICO scores. But thanks to the company’s
sensible lending practices, its portfolio performed well during the recession, meaning a very high percentage of our
borrowers kept their homes. Our blue-collar borrowers, in many cases, proved much better credit risks than their
higher-income brethren.
At Marmon’s railroad-car operation, lease rates have improved substantially over the past few years. The
nature of this business, however, is that only 20% or so of our leases expire annually. Consequently, improved
pricing only gradually works its way into our revenue stream. The trend, though, is strong. Our 105,000-car fleet
consists largely of tank cars, but only 8% of those transport crude oil.
One further fact about our rail operation is important for you to know: Unlike many other lessors, we
manufacture our own tank cars, about 6,000 of them in a good year. We do not book any profit when we transfer
cars from our manufacturing division to our leasing division. Our fleet is consequently placed on our books at a
“bargain” price. The difference between that figure and a “retail” price is only slowly reflected in our earnings
through smaller annual depreciation charges that we enjoy over the 30-year life of the car. Because of that fact as
well as others, Marmon’s rail fleet is worth considerably more than the $5 billion figure at which it is carried on our
books.
Here’s the earnings recap for this sector:
2014 2013 2012
(in millions)
Berkadia (our 50% share) ............. $ 122 $ 80 $ 35
Clayton ............................... 558 416 255
CORT ................................ 36 40 42
Marmon – Containers and Cranes ..... 238 226 246
Marmon – Railcars .................... 442 353 299
XTRA ................................ 147 125 106
Net financial income* ................. 296 324 410
$ 1,839 $ 1,564 $ 1,393
* Excludes capital gains or losses
16