Berkshire Hathaway 2014 Annual Report Download - page 114
Download and view the complete annual report
Please find page 114 of the 2014 Berkshire Hathaway annual report below. You can navigate through the pages in the report by either clicking on the pages listed below, or by using the keyword search tool below to find specific information within the annual report.-
 1
1 -
2
-
3
-
4
-
5
-
6
-
7
-
8
-
9
-
10
-
11
-
12
-
13
-
14
-
15
-
16
-
17
-
18
-
19
-
20
-
21
-
22
-
23
-
24
-
25
-
26
-
27
-
28
-
29
-
30
-
31
-
32
-
33
-
34
-
35
-
36
-
37
-
38
-
39
-
40
-
41
-
42
-
43
-
44
-
45
-
46
-
47
-
48
-
49
-
50
-
51
-
52
-
53
-
54
-
55
-
56
-
57
-
58
-
59
-
60
-
61
-
62
-
63
-
64
-
65
-
66
-
67
-
68
-
69
-
70
-
71
-
72
-
73
-
74
-
75
-
76
-
77
-
78
-
79
-
80
-
81
-
82
-
83
-
84
-
85
-
86
-
87
-
88
-
89
-
90
-
91
-
92
-
93
-
94
-
95
-
96
-
97
-
98
-
99
-
100
-
101
-
102
-
103
-
 104
104 -
 105
105 -
 106
106 -
 107
107 -
 108
108 -
 109
109 -
 110
110 -
 111
111 -
 112
112 -
 113
113 -
 114
114 -
 115
115 -
 116
116 -
 117
117 -
 118
118 -
 119
119 -
 120
120 -
 121
121 -
 122
122 -
 123
123 -
 124
124 -
125
-
126
-
127
-
128
-
129
-
130
-
131
-
132
-
133
-
134
-
135
-
136
-
137
-
138
-
139
-
140
-
141
-
142
-
143
-
144
-
145
-
146
-
147
-
148
 |
 |

Management’s Discussion (Continued)
Property and casualty losses (Continued)
BHRG (Continued)
Under most of our non-catastrophe property and casualty treaties, liabilities for unpaid losses and loss adjustments
expenses are generally based upon loss estimates reported by ceding companies and IBNR reserves that are primarily a function
of reported losses from ceding companies and anticipated loss ratios established on a portfolio basis, supplemented by
management’s estimates of the impact of major catastrophe events as they become known. Anticipated loss ratios are based
upon management’s judgment considering the type of business covered, analysis of each ceding company’s loss history and
evaluation of that portion of the underlying contracts underwritten by each ceding company, which are in turn ceded to BHRG.
A range of reserve amounts as a result of changes in underlying assumptions is not prepared. For BHRG’s property/casualty
contracts other than retroactive reinsurance, we decreased estimated ultimate losses for prior years’ occurrences by
approximately $889 million in 2014 and $714 million in 2013. In both years, the decreases primarily derived from lower than
expected losses reported by ceding companies. These decreases produced corresponding increases in pre-tax earnings in 2014
and 2013.
Derivative contract liabilities
Our Consolidated Balance Sheets include significant derivative contract liabilities that are measured at fair value. Our most
significant derivative contract exposures relate to equity index put option contracts written between 2004 and 2008. These
contracts were entered into in over-the-counter markets. Certain elements of the terms and conditions of these contracts are not
standard and we are not required to post collateral under most of these contracts. Furthermore, there is no source of independent
data available to us showing trading volume and actual prices of completed transactions. As a result, the values of these
liabilities are based on valuation models that we believe would be used by market participants. Such models or other valuation
techniques use inputs that are observable in the marketplace, while others are unobservable. Unobservable inputs require us to
make certain projections and assumptions about the information that would be used by market participants in establishing
prices. We believe that the fair values produced for long-duration options are inherently subjective. The values of contracts in an
actual exchange are affected by market conditions and perceptions of the buyers and sellers. Actual values in an exchange may
differ significantly from the values produced by any mathematical model.
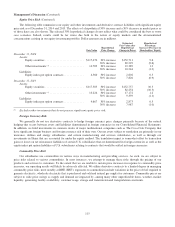
We determine the estimated fair value of equity index put option contracts using a Black-Scholes based option valuation
model. Inputs to the model include the current index value, strike price, interest rate, dividend rate and contract expiration date.
The weighted average interest and dividend rates used as of December 31, 2014 were 1.5% and 3.3%, respectively, and were
2.5% and 3.6%, respectively, as of December 31, 2013. The interest rates as of December 31, 2014 and 2013 were
approximately 53 basis points and 64 basis points (on a weighted average basis), respectively, over benchmark interest rates and
represented our estimate of our nonperformance risk. We believe that the most significant economic risks under these contracts
relate to changes in the index value component and, to a lesser degree, the foreign currency component.
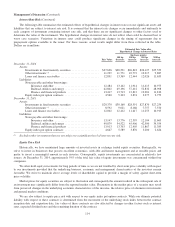
The Black-Scholes based model also incorporates volatility estimates that measure potential price changes over time. Our
contracts have an average remaining maturity of about 6 years. The weighted average volatility used as of December 31, 2014
was approximately 20.9%, compared to 20.7% as of December 31, 2013. The weighted average volatilities are based on the
volatility input for each equity index put option contract weighted by the notional value of each equity index put option contract
as compared to the aggregate notional value of all equity index put option contracts. The volatility input for each equity index
put option contract reflects our expectation of future price volatility. The impact on fair value as of December 31, 2014
($4.6 billion) from changes in the volatility assumption is summarized in the table that follows. Dollars are in millions.
Hypothetical change in volatility (percentage points) Hypothetical fair value
Increase 2 percentage points .............................................................. $4,899
Increase 4 percentage points .............................................................. 5,252
Decrease 2 percentage points .............................................................. 4,237
Decrease 4 percentage points .............................................................. 3,935
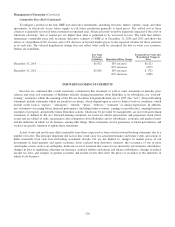
For several years, we also have had exposures relating to a number of credit default contracts written involving corporate
and state/municipality issuers. At December 31, 2014, our remaining exposures relate to state/municipality exposures which
begin to expire in 2019. The fair values of our state/municipality contracts are generally based on pricing data and current
ratings on the underlying bond issues and credit spread estimates. We monitor and review pricing data and spread estimates for
consistency as well as reasonableness with respect to current market conditions.
112