APS 2011 Annual Report Download - page 99
Download and view the complete annual report
Please find page 99 of the 2011 APS annual report below. You can navigate through the pages in the report by either clicking on the pages listed below, or by using the keyword search tool below to find specific information within the annual report.-
 1
1 -
2
-
3
-
4
-
5
-
6
-
7
-
8
-
9
-
10
-
11
-
12
-
13
-
14
-
15
-
16
-
17
-
18
-
19
-
20
-
21
-
22
-
23
-
24
-
25
-
26
-
27
-
28
-
29
-
30
-
31
-
32
-
33
-
34
-
35
-
36
-
37
-
38
-
39
-
40
-
41
-
42
-
43
-
44
-
45
-
46
-
47
-
48
-
49
-
50
-
51
-
52
-
53
-
54
-
55
-
56
-
57
-
58
-
59
-
60
-
61
-
62
-
63
-
64
-
65
-
66
-
67
-
68
-
69
-
70
-
71
-
72
-
73
-
74
-
75
-
76
-
77
-
78
-
79
-
80
-
81
-
82
-
83
-
84
-
85
-
86
-
87
-
88
-
 89
89 -
 90
90 -
 91
91 -
 92
92 -
 93
93 -
 94
94 -
 95
95 -
 96
96 -
 97
97 -
 98
98 -
 99
99 -
 100
100 -
 101
101 -
 102
102 -
 103
103 -
 104
104 -
 105
105 -
 106
106 -
 107
107 -
 108
108 -
 109
109 -
110
-
111
-
112
-
113
-
114
-
115
-
116
-
117
-
118
-
119
-
120
-
121
-
122
-
123
-
124
-
125
-
126
-
127
-
128
-
129
-
130
-
131
-
132
-
133
-
134
-
135
-
136
-
137
-
138
-
139
-
140
-
141
-
142
-
143
-
144
-
145
-
146
-
147
-
148
-
149
-
150
-
151
-
152
-
153
-
154
-
155
-
156
-
157
-
158
-
159
-
160
-
161
-
162
-
163
-
164
-
165
-
166
-
167
-
168
-
169
-
170
-
171
-
172
-
173
-
174
-
175
-
176
-
177
-
178
-
179
-
180
-
181
-
182
-
183
-
184
-
185
-
186
-
187
-
188
-
189
-
190
-
191
-
192
-
193
-
194
-
195
-
196
-
197
-
198
-
199
-
200
-
201
-
202
-
203
-
204
-
205
-
206
-
207
-
208
-
209
-
210
-
211
-
212
-
213
-
214
-
215
-
216
-
217
-
218
-
219
-
220
-
221
-
222
-
223
-
224
-
225
-
226
-
227
-
228
-
229
-
230
-
231
-
232
-
233
-
234
-
235
-
236
-
237
-
238
-
239
-
240
-
241
-
242
-
243
-
244
-
245
-
246
-
247
-
248
 |
 |

75
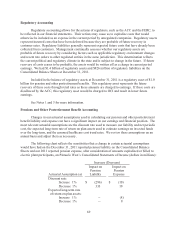
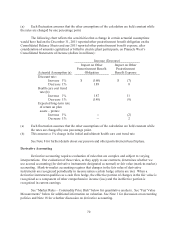
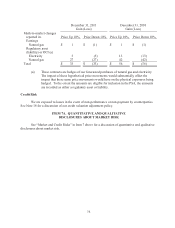
(a) These contracts are hedges of our forecasted purchases of natural gas and electricity.
The impact of these hypothetical price movements would substantially offset the
impact that these same price movements would have on the physical exposures being
hedged. To the extent the amounts are eligible for inclusion in the PSA, the amounts
are recorded as either a regulatory asset or liability.
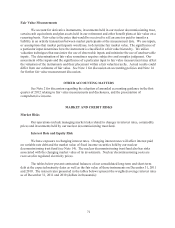
Credit Risk
We are exposed to losses in the event of non-performance or non-payment by counterparties.
See Note 18 for a discussion of our credit valuation adjustment policy.
ITEM 7A. QUANTITATIVE AND QUALITATIVE
DISCLOSURES ABOUT MARKET RISK
See “Market and Credit Risks” in Item 7 above for a discussion of quantitative and qualitative
disclosures about market risk.
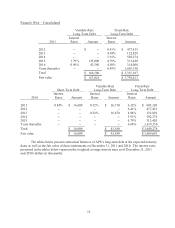
December 31, 2011
Gain (Loss)
December 31, 2010
Gain (Loss)
Mark-to-market changes
reported in: Price Up 10% Price Down 10% Price Up 10% Price Down 10%
Earnings
Natural gas $ 1 $ (1) $ 1 $ (1)
Regulatory asset
(liability) or OCI (a)
Electricity 5 (5) 13 (13)
Natural gas 27 (27) 42 (42)
Total $ 33 $ (33) $ 56 $ (56)