APS 2011 Annual Report Download - page 94
Download and view the complete annual report
Please find page 94 of the 2011 APS annual report below. You can navigate through the pages in the report by either clicking on the pages listed below, or by using the keyword search tool below to find specific information within the annual report.-
 1
1 -
2
-
3
-
4
-
5
-
6
-
7
-
8
-
9
-
10
-
11
-
12
-
13
-
14
-
15
-
16
-
17
-
18
-
19
-
20
-
21
-
22
-
23
-
24
-
25
-
26
-
27
-
28
-
29
-
30
-
31
-
32
-
33
-
34
-
35
-
36
-
37
-
38
-
39
-
40
-
41
-
42
-
43
-
44
-
45
-
46
-
47
-
48
-
49
-
50
-
51
-
52
-
53
-
54
-
55
-
56
-
57
-
58
-
59
-
60
-
61
-
62
-
63
-
64
-
65
-
66
-
67
-
68
-
69
-
70
-
71
-
72
-
73
-
74
-
75
-
76
-
77
-
78
-
79
-
80
-
81
-
82
-
83
-
 84
84 -
 85
85 -
 86
86 -
 87
87 -
 88
88 -
 89
89 -
 90
90 -
 91
91 -
 92
92 -
 93
93 -
 94
94 -
 95
95 -
 96
96 -
 97
97 -
 98
98 -
 99
99 -
 100
100 -
 101
101 -
 102
102 -
 103
103 -
 104
104 -
105
-
106
-
107
-
108
-
109
-
110
-
111
-
112
-
113
-
114
-
115
-
116
-
117
-
118
-
119
-
120
-
121
-
122
-
123
-
124
-
125
-
126
-
127
-
128
-
129
-
130
-
131
-
132
-
133
-
134
-
135
-
136
-
137
-
138
-
139
-
140
-
141
-
142
-
143
-
144
-
145
-
146
-
147
-
148
-
149
-
150
-
151
-
152
-
153
-
154
-
155
-
156
-
157
-
158
-
159
-
160
-
161
-
162
-
163
-
164
-
165
-
166
-
167
-
168
-
169
-
170
-
171
-
172
-
173
-
174
-
175
-
176
-
177
-
178
-
179
-
180
-
181
-
182
-
183
-
184
-
185
-
186
-
187
-
188
-
189
-
190
-
191
-
192
-
193
-
194
-
195
-
196
-
197
-
198
-
199
-
200
-
201
-
202
-
203
-
204
-
205
-
206
-
207
-
208
-
209
-
210
-
211
-
212
-
213
-
214
-
215
-
216
-
217
-
218
-
219
-
220
-
221
-
222
-
223
-
224
-
225
-
226
-
227
-
228
-
229
-
230
-
231
-
232
-
233
-
234
-
235
-
236
-
237
-
238
-
239
-
240
-
241
-
242
-
243
-
244
-
245
-
246
-
247
-
248
 |
 |

70
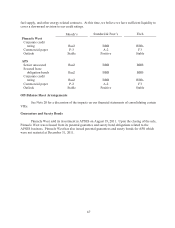
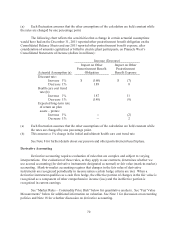
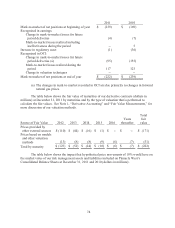
(a) Each fluctuation assumes that the other assumptions of the calculation are held constant while
the rates are changed by one percentage point.
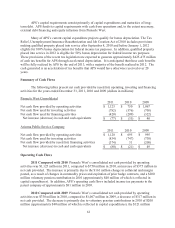
The following chart reflects the sensitivities that a change in certain actuarial assumptions
would have had on the December 31, 2011 reported other postretirement benefit obligation on the
Consolidated Balance Sheets and our 2011 reported other postretirement benefit expense, after
consideration of amounts capitalized or billed to electric plant participants, on Pinnacle West’s
Consolidated Statements of Income (dollars in millions):
Increase (Decrease)
Actuarial Assumption (a)
Impact on Other
Postretirement Benefit
Obligation
Impact on Other
Postretirement
Benefit Expense
Discount rate:
Increase 1% $ (160) $ (7)
Decrease 1% 189 8
Health care cost trend
rate (b):
Increase 1% 187 11
Decrease 1% (148) (9)
Expected long-term rate
of return on plan
assets – pretax:
Increase 1% -- (2)
Decrease 1% -- 2
(a) Each fluctuation assumes that the other assumptions of the calculation are held constant while
the rates are changed by one percentage point.
(b) This assumes a 1% change in the initial and ultimate health care cost trend rate.
See Note 8 for further details about our pension and other postretirement benefit plans.
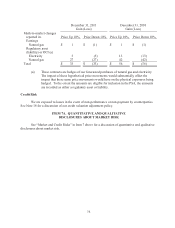
Derivative Accounting
Derivative accounting requires evaluation of rules that are complex and subject to varying
interpretations. Our evaluation of these rules, as they apply to our contracts, determines whether we
use accrual accounting (for derivative instruments designated as normal) or fair value (mark-to-market)
accounting. Mark-to-market accounting requires that changes in the fair value of derivative
instruments are recognized periodically in income unless certain hedge criteria are met. When a
derivative instrument qualifies as a cash flow hedge, the effective portion of changes in the fair value is
recognized as a component of other comprehensive income (loss) and the ineffective portion is
recognized in current earnings.
See “Market Risks – Commodity Price Risk” below for quantitative analysis. See “Fair Value
Measurements” below for additional information on valuation. See Note 1 for discussion on accounting
policies and Note 18 for a further discussion on derivative accounting.