APS 2011 Annual Report Download - page 145
Download and view the complete annual report
Please find page 145 of the 2011 APS annual report below. You can navigate through the pages in the report by either clicking on the pages listed below, or by using the keyword search tool below to find specific information within the annual report.-
 1
1 -
2
-
3
-
4
-
5
-
6
-
7
-
8
-
9
-
10
-
11
-
12
-
13
-
14
-
15
-
16
-
17
-
18
-
19
-
20
-
21
-
22
-
23
-
24
-
25
-
26
-
27
-
28
-
29
-
30
-
31
-
32
-
33
-
34
-
35
-
36
-
37
-
38
-
39
-
40
-
41
-
42
-
43
-
44
-
45
-
46
-
47
-
48
-
49
-
50
-
51
-
52
-
53
-
54
-
55
-
56
-
57
-
58
-
59
-
60
-
61
-
62
-
63
-
64
-
65
-
66
-
67
-
68
-
69
-
70
-
71
-
72
-
73
-
74
-
75
-
76
-
77
-
78
-
79
-
80
-
81
-
82
-
83
-
84
-
85
-
86
-
87
-
88
-
89
-
90
-
91
-
92
-
93
-
94
-
95
-
96
-
97
-
98
-
99
-
100
-
101
-
102
-
103
-
104
-
105
-
106
-
107
-
108
-
109
-
110
-
111
-
112
-
113
-
114
-
115
-
116
-
117
-
118
-
119
-
120
-
121
-
122
-
123
-
124
-
125
-
126
-
127
-
128
-
129
-
130
-
131
-
132
-
133
-
134
-
 135
135 -
 136
136 -
 137
137 -
 138
138 -
 139
139 -
 140
140 -
 141
141 -
 142
142 -
 143
143 -
 144
144 -
 145
145 -
 146
146 -
 147
147 -
 148
148 -
 149
149 -
 150
150 -
 151
151 -
 152
152 -
 153
153 -
 154
154 -
 155
155 -
156
-
157
-
158
-
159
-
160
-
161
-
162
-
163
-
164
-
165
-
166
-
167
-
168
-
169
-
170
-
171
-
172
-
173
-
174
-
175
-
176
-
177
-
178
-
179
-
180
-
181
-
182
-
183
-
184
-
185
-
186
-
187
-
188
-
189
-
190
-
191
-
192
-
193
-
194
-
195
-
196
-
197
-
198
-
199
-
200
-
201
-
202
-
203
-
204
-
205
-
206
-
207
-
208
-
209
-
210
-
211
-
212
-
213
-
214
-
215
-
216
-
217
-
218
-
219
-
220
-
221
-
222
-
223
-
224
-
225
-
226
-
227
-
228
-
229
-
230
-
231
-
232
-
233
-
234
-
235
-
236
-
237
-
238
-
239
-
240
-
241
-
242
-
243
-
244
-
245
-
246
-
247
-
248
 |
 |

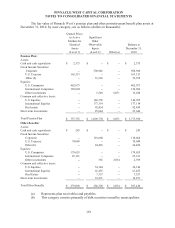
PINNACLE WEST CAPITAL CORPORATION
NOTES TO CONSOLIDATED FINANCIAL STATEMENTS
120
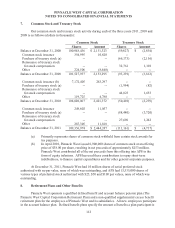
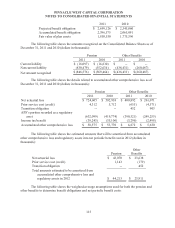
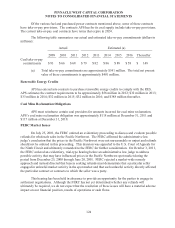
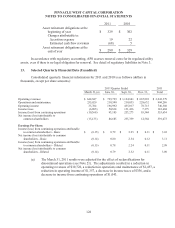
The following table shows the changes in fair value for assets that are measured at fair value on
a recurring basis using significant unobservable inputs (Level 3) for the year ended December 31, 2010
(dollars in thousands):
Year Ended
December 31, 2010
Common and Collective Trusts – Real Estate Pension
Other
Benefits
Beginning balance at January 1 $ 64,212 $ 6,504
Actual return on assets still held (a) (204) (23)
Purchases, sales, and settlements 18,003 45
Transfers in and/or out of Level 3 (b) (82,011) (6,526)
Ending balance at December 31 $ --
$ --
(a) The return for December 31, 2010 represents the return on assets held as of March 31,
2010, the beginning of the period in which all the assets were transferred out of
Level 3.
(b) Transfers into and out of Level 3 are measured at the beginning of the period in which
the transfer occurs. Transfers out of Level 3 during 2010 relate to our Real Estate
Common and Collective Trust being transferred to a Level 2 investment. During 2009
the Real Estate Common and Collective Trust had special redemption restrictions in
place, which limited our ability to transact at the trust’s NAV. During 2010 these
special redemption restrictions were lifted, and in 2010 and 2011 we were able to
transact at the NAV according to the trust’s contractual redemption policy.
The plans had no investments valued using significant unobservable inputs (Level 3) for the year ended
December 31, 2011.
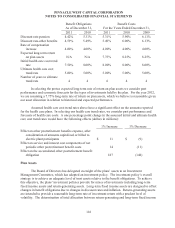
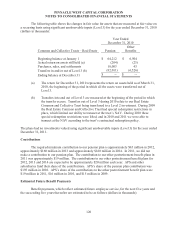
Contributions
The required minimum contribution to our pension plan is approximately $65 million in 2012,
approximately $160 million in 2013 and approximately $160 million in 2014. In 2011, we did not
make a contribution to our pension plan. The contribution to our other postretirement benefit plans in
2011 was approximately $19 million. The contributions to our other postretirement benefit plans for
2012, 2013 and 2014 are expected to be approximately $20 million each year. APS and other
subsidiaries fund their share of the contributions. APS’s share of the pension plan contribution was
$195 million in 2010. APS’s share of the contributions to the other postretirement benefit plan were
$19 million in 2011, $16 million in 2010, and $15 million in 2009.
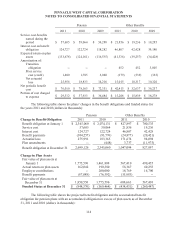
Estimated Future Benefit Payments
Benefit payments, which reflect estimated future employee service, for the next five years and
the succeeding five years thereafter are estimated to be as follows (dollars in thousands):