APS 2011 Annual Report Download - page 160
Download and view the complete annual report
Please find page 160 of the 2011 APS annual report below. You can navigate through the pages in the report by either clicking on the pages listed below, or by using the keyword search tool below to find specific information within the annual report.-
 1
1 -
2
-
3
-
4
-
5
-
6
-
7
-
8
-
9
-
10
-
11
-
12
-
13
-
14
-
15
-
16
-
17
-
18
-
19
-
20
-
21
-
22
-
23
-
24
-
25
-
26
-
27
-
28
-
29
-
30
-
31
-
32
-
33
-
34
-
35
-
36
-
37
-
38
-
39
-
40
-
41
-
42
-
43
-
44
-
45
-
46
-
47
-
48
-
49
-
50
-
51
-
52
-
53
-
54
-
55
-
56
-
57
-
58
-
59
-
60
-
61
-
62
-
63
-
64
-
65
-
66
-
67
-
68
-
69
-
70
-
71
-
72
-
73
-
74
-
75
-
76
-
77
-
78
-
79
-
80
-
81
-
82
-
83
-
84
-
85
-
86
-
87
-
88
-
89
-
90
-
91
-
92
-
93
-
94
-
95
-
96
-
97
-
98
-
99
-
100
-
101
-
102
-
103
-
104
-
105
-
106
-
107
-
108
-
109
-
110
-
111
-
112
-
113
-
114
-
115
-
116
-
117
-
118
-
119
-
120
-
121
-
122
-
123
-
124
-
125
-
126
-
127
-
128
-
129
-
130
-
131
-
132
-
133
-
134
-
135
-
136
-
137
-
138
-
139
-
140
-
141
-
142
-
143
-
144
-
145
-
146
-
147
-
148
-
149
-
 150
150 -
 151
151 -
 152
152 -
 153
153 -
 154
154 -
 155
155 -
 156
156 -
 157
157 -
 158
158 -
 159
159 -
 160
160 -
 161
161 -
 162
162 -
 163
163 -
 164
164 -
 165
165 -
 166
166 -
 167
167 -
 168
168 -
 169
169 -
 170
170 -
171
-
172
-
173
-
174
-
175
-
176
-
177
-
178
-
179
-
180
-
181
-
182
-
183
-
184
-
185
-
186
-
187
-
188
-
189
-
190
-
191
-
192
-
193
-
194
-
195
-
196
-
197
-
198
-
199
-
200
-
201
-
202
-
203
-
204
-
205
-
206
-
207
-
208
-
209
-
210
-
211
-
212
-
213
-
214
-
215
-
216
-
217
-
218
-
219
-
220
-
221
-
222
-
223
-
224
-
225
-
226
-
227
-
228
-
229
-
230
-
231
-
232
-
233
-
234
-
235
-
236
-
237
-
238
-
239
-
240
-
241
-
242
-
243
-
244
-
245
-
246
-
247
-
248
 |
 |

PINNACLE WEST CAPITAL CORPORATION
NOTES TO CONSOLIDATED FINANCIAL STATEMENTS
135
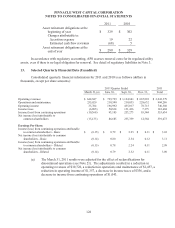
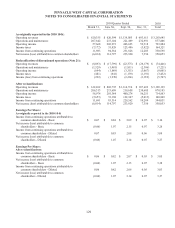
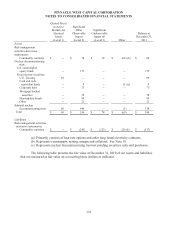
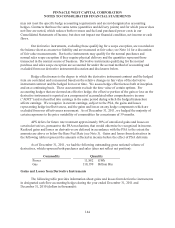
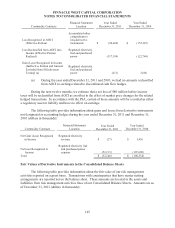
The following table shows the changes in fair value for assets and liabilities that are
measured at fair value on a recurring basis using Level 3 inputs for the years ended December 31,
2011 and 2010 (dollars in millions):
Year Ended
December 31,
2011 2010
Net risk management activities at beginning of period $ (38) $ (10)
Total net gains (losses) realized/unrealized:
Included in earnings 2 (1)
Included in OCI (5) (14)
Deferred as a regulatory asset or liability (10) (38)
Settlements 11 19
Transfers into Level 3 from Level 2 (4) 5
Transfers from Level 3 into Level 2 (7) 1
Net risk management activities at end of period $ (51) $ (38)
Net unrealized gains (losses) included in earnings related
to instruments still held at end of period $ 1 $ (1)
Amounts included in earnings are recorded in either regulated electricity segment revenue or
regulated electricity segment fuel and purchased power depending on the nature of the underlying
contract.
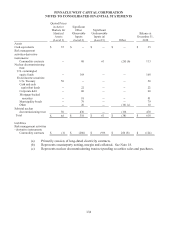
Transfers reflect the fair market value at the beginning of the period and are triggered by a
change in the lowest significant input as of the end of the period. We had no significant Level 1
transfers to or from any other hierarchy level. Transfers in or out of Level 3 are generally related to
changes in the significance of reserves applied to derivative instruments. Transfers out of Level 3
may also be related to our long-dated energy transactions as they move closer to delivery and quoted
prices become available.
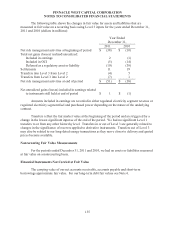
Nonrecurring Fair Value Measurements
For the periods ended December 31, 2011 and 2010, we had no assets or liabilities measured
at fair value on a nonrecurring basis.
Financial Instruments Not Carried at Fair Value
The carrying value of our net accounts receivable, accounts payable and short-term
borrowings approximate fair value. For our long-term debt fair values see Note 6.