APS 2011 Annual Report Download - page 83
Download and view the complete annual report
Please find page 83 of the 2011 APS annual report below. You can navigate through the pages in the report by either clicking on the pages listed below, or by using the keyword search tool below to find specific information within the annual report.-
 1
1 -
2
-
3
-
4
-
5
-
6
-
7
-
8
-
9
-
10
-
11
-
12
-
13
-
14
-
15
-
16
-
17
-
18
-
19
-
20
-
21
-
22
-
23
-
24
-
25
-
26
-
27
-
28
-
29
-
30
-
31
-
32
-
33
-
34
-
35
-
36
-
37
-
38
-
39
-
40
-
41
-
42
-
43
-
44
-
45
-
46
-
47
-
48
-
49
-
50
-
51
-
52
-
53
-
54
-
55
-
56
-
57
-
58
-
59
-
60
-
61
-
62
-
63
-
64
-
65
-
66
-
67
-
68
-
69
-
70
-
71
-
72
-
 73
73 -
 74
74 -
 75
75 -
 76
76 -
 77
77 -
 78
78 -
 79
79 -
 80
80 -
 81
81 -
 82
82 -
 83
83 -
 84
84 -
 85
85 -
 86
86 -
 87
87 -
 88
88 -
 89
89 -
 90
90 -
 91
91 -
 92
92 -
 93
93 -
94
-
95
-
96
-
97
-
98
-
99
-
100
-
101
-
102
-
103
-
104
-
105
-
106
-
107
-
108
-
109
-
110
-
111
-
112
-
113
-
114
-
115
-
116
-
117
-
118
-
119
-
120
-
121
-
122
-
123
-
124
-
125
-
126
-
127
-
128
-
129
-
130
-
131
-
132
-
133
-
134
-
135
-
136
-
137
-
138
-
139
-
140
-
141
-
142
-
143
-
144
-
145
-
146
-
147
-
148
-
149
-
150
-
151
-
152
-
153
-
154
-
155
-
156
-
157
-
158
-
159
-
160
-
161
-
162
-
163
-
164
-
165
-
166
-
167
-
168
-
169
-
170
-
171
-
172
-
173
-
174
-
175
-
176
-
177
-
178
-
179
-
180
-
181
-
182
-
183
-
184
-
185
-
186
-
187
-
188
-
189
-
190
-
191
-
192
-
193
-
194
-
195
-
196
-
197
-
198
-
199
-
200
-
201
-
202
-
203
-
204
-
205
-
206
-
207
-
208
-
209
-
210
-
211
-
212
-
213
-
214
-
215
-
216
-
217
-
218
-
219
-
220
-
221
-
222
-
223
-
224
-
225
-
226
-
227
-
228
-
229
-
230
-
231
-
232
-
233
-
234
-
235
-
236
-
237
-
238
-
239
-
240
-
241
-
242
-
243
-
244
-
245
-
246
-
247
-
248
 |
 |

59
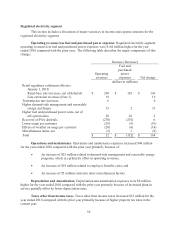
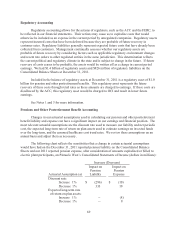
Regulated electricity segment
This section includes a discussion of major variances in income and expense amounts for the
regulated electricity segment.
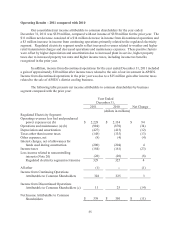
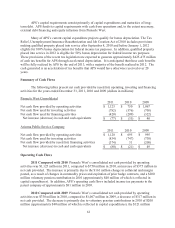
Operating revenues less fuel and purchased power expenses Regulated electricity segment
operating revenues less fuel and purchased power expenses were $164 million higher for the year
ended 2010 compared with the prior year. The following table describes the major components of this
change:
Increase (Decrease)
Operating
revenues
Fuel and
purchased
power
expenses Net change
(dollars in millions)
Retail regulatory settlement effective
January 1, 2010:
Retail base rate increases, net of deferrals $ 269 $ 128 $ 141
Line extension revenues (Note 3) 19 19
Transmission rate increases 6 6
Higher demand-side management and renewable
energy surcharges 33 2 31
Higher fuel and purchased power costs, net of
off-system sales 28 26 2
Recovery of PSA deferrals (270) (276) 6
Lower usage per customer (28) (9) (19)
Effects of weather on usage per customer (20) (6) (14)
Miscellaneous items, net (5) 3 (8)
Total $ 32 $ (132) $ 164
Operations and maintenance Operations and maintenance expenses increased $48 million
for the year ended 2010 compared with the prior year primarily because of:
An increase of $25 million related to demand-side management and renewable energy
programs, which are primarily offset in operating revenues;
An increase of $18 million related to employee benefits costs; and
An increase of $5 million related to other miscellaneous factors.
Depreciation and Amortization Depreciation and amortization expenses were $8 million
higher for the year ended 2010 compared with the prior year primarily because of increased plant in
service partially offset by lower depreciation rates.
Taxes other than income taxes Taxes other than income taxes increased $12 million for the
year ended 2010 compared with the prior year primarily because of higher property tax rates in the
current year.