APS 2011 Annual Report Download - page 115
Download and view the complete annual report
Please find page 115 of the 2011 APS annual report below. You can navigate through the pages in the report by either clicking on the pages listed below, or by using the keyword search tool below to find specific information within the annual report.-
 1
1 -
2
-
3
-
4
-
5
-
6
-
7
-
8
-
9
-
10
-
11
-
12
-
13
-
14
-
15
-
16
-
17
-
18
-
19
-
20
-
21
-
22
-
23
-
24
-
25
-
26
-
27
-
28
-
29
-
30
-
31
-
32
-
33
-
34
-
35
-
36
-
37
-
38
-
39
-
40
-
41
-
42
-
43
-
44
-
45
-
46
-
47
-
48
-
49
-
50
-
51
-
52
-
53
-
54
-
55
-
56
-
57
-
58
-
59
-
60
-
61
-
62
-
63
-
64
-
65
-
66
-
67
-
68
-
69
-
70
-
71
-
72
-
73
-
74
-
75
-
76
-
77
-
78
-
79
-
80
-
81
-
82
-
83
-
84
-
85
-
86
-
87
-
88
-
89
-
90
-
91
-
92
-
93
-
94
-
95
-
96
-
97
-
98
-
99
-
100
-
101
-
102
-
103
-
104
-
 105
105 -
 106
106 -
 107
107 -
 108
108 -
 109
109 -
 110
110 -
 111
111 -
 112
112 -
 113
113 -
 114
114 -
 115
115 -
 116
116 -
 117
117 -
 118
118 -
 119
119 -
 120
120 -
 121
121 -
 122
122 -
 123
123 -
 124
124 -
 125
125 -
126
-
127
-
128
-
129
-
130
-
131
-
132
-
133
-
134
-
135
-
136
-
137
-
138
-
139
-
140
-
141
-
142
-
143
-
144
-
145
-
146
-
147
-
148
-
149
-
150
-
151
-
152
-
153
-
154
-
155
-
156
-
157
-
158
-
159
-
160
-
161
-
162
-
163
-
164
-
165
-
166
-
167
-
168
-
169
-
170
-
171
-
172
-
173
-
174
-
175
-
176
-
177
-
178
-
179
-
180
-
181
-
182
-
183
-
184
-
185
-
186
-
187
-
188
-
189
-
190
-
191
-
192
-
193
-
194
-
195
-
196
-
197
-
198
-
199
-
200
-
201
-
202
-
203
-
204
-
205
-
206
-
207
-
208
-
209
-
210
-
211
-
212
-
213
-
214
-
215
-
216
-
217
-
218
-
219
-
220
-
221
-
222
-
223
-
224
-
225
-
226
-
227
-
228
-
229
-
230
-
231
-
232
-
233
-
234
-
235
-
236
-
237
-
238
-
239
-
240
-
241
-
242
-
243
-
244
-
245
-
246
-
247
-
248
 |
 |
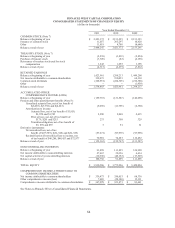
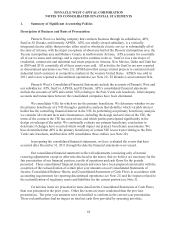
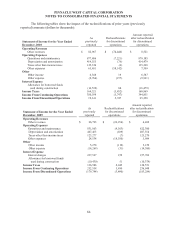
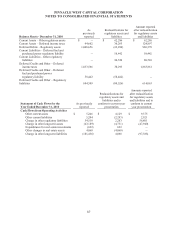
PINNACLE WEST CAPITAL CORPORATION
NOTES TO CONSOLIDATED FINANCIAL STATEMENTS
90
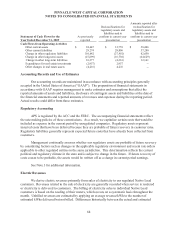
APS records a regulatory liability for the asset retirement obligations related to its regulated
assets. This regulatory liability represents the difference between the amount that has been recovered
in regulated rates and the amount calculated in accordance with guidance on accounting for asset
retirement obligations. APS believes it can recover in regulated rates the costs capitalized in
accordance with this accounting guidance.
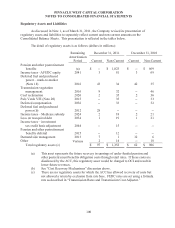
We record depreciation on utility plant on a straight-line basis over the remaining useful life of
the related assets. The approximate remaining average useful lives of our utility property at
December 31, 2011 were as follows:
Fossil plant – 18 years;
Nuclear plant – 29 years;
Other generation – 28 years;
Transmission – 38 years;
Distribution – 35 years; and
Other – 7 years.
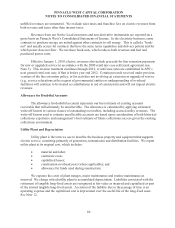
APS applied for twenty-year extensions of its operating licenses for each of the three Palo
Verde units in December 2008. On April 21, 2011, the NRC approved the extensions of the Palo
Verde licenses. The nuclear plant remaining life takes into consideration an ACC decision which
authorizes the new Palo Verde Nuclear plant lives, effective January 1, 2012.
For the years 2009 through 2011, the depreciation rates ranged from a low of 1.30% to a high
of 10.20%. The weighted-average rate was 2.98% for 2011, 2.98% for 2010, and 3.06% for 2009.
Allowance for Funds Used During Construction
AFUDC represents the approximate net composite interest cost of borrowed funds and an
allowed return on the equity funds used for construction of regulated utility plant. Both the debt and
equity components of AFUDC are non-cash amounts within the Consolidated Statement of Income.
Plant construction costs, including AFUDC, are recovered in authorized rates through depreciation
when completed projects are placed into commercial operation.
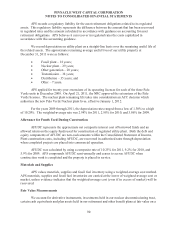
AFUDC was calculated by using a composite rate of 10.25% for 2011, 9.2% for 2010, and
5.9% for 2009. APS compounds AFUDC semi-annually and ceases to accrue AFUDC when
construction work is completed and the property is placed in service.
Materials and Supplies
APS values materials, supplies and fossil fuel inventory using a weighted-average cost method.
APS materials, supplies and fossil fuel inventories are carried at the lower of weighted-average cost or
market, unless evidence indicates that the weighted-average cost (even if in excess of market) will be
recovered.
Fair Value Measurements
We account for derivative instruments, investments held in our nuclear decommissioning trust,
certain cash equivalents and plan assets held in our retirement and other benefit plans at fair value on a