APS 2011 Annual Report Download - page 188
Download and view the complete annual report
Please find page 188 of the 2011 APS annual report below. You can navigate through the pages in the report by either clicking on the pages listed below, or by using the keyword search tool below to find specific information within the annual report.-
 1
1 -
2
-
3
-
4
-
5
-
6
-
7
-
8
-
9
-
10
-
11
-
12
-
13
-
14
-
15
-
16
-
17
-
18
-
19
-
20
-
21
-
22
-
23
-
24
-
25
-
26
-
27
-
28
-
29
-
30
-
31
-
32
-
33
-
34
-
35
-
36
-
37
-
38
-
39
-
40
-
41
-
42
-
43
-
44
-
45
-
46
-
47
-
48
-
49
-
50
-
51
-
52
-
53
-
54
-
55
-
56
-
57
-
58
-
59
-
60
-
61
-
62
-
63
-
64
-
65
-
66
-
67
-
68
-
69
-
70
-
71
-
72
-
73
-
74
-
75
-
76
-
77
-
78
-
79
-
80
-
81
-
82
-
83
-
84
-
85
-
86
-
87
-
88
-
89
-
90
-
91
-
92
-
93
-
94
-
95
-
96
-
97
-
98
-
99
-
100
-
101
-
102
-
103
-
104
-
105
-
106
-
107
-
108
-
109
-
110
-
111
-
112
-
113
-
114
-
115
-
116
-
117
-
118
-
119
-
120
-
121
-
122
-
123
-
124
-
125
-
126
-
127
-
128
-
129
-
130
-
131
-
132
-
133
-
134
-
135
-
136
-
137
-
138
-
139
-
140
-
141
-
142
-
143
-
144
-
145
-
146
-
147
-
148
-
149
-
150
-
151
-
152
-
153
-
154
-
155
-
156
-
157
-
158
-
159
-
160
-
161
-
162
-
163
-
164
-
165
-
166
-
167
-
168
-
169
-
170
-
171
-
172
-
173
-
174
-
175
-
176
-
177
-
 178
178 -
 179
179 -
 180
180 -
 181
181 -
 182
182 -
 183
183 -
 184
184 -
 185
185 -
 186
186 -
 187
187 -
 188
188 -
 189
189 -
 190
190 -
 191
191 -
 192
192 -
 193
193 -
 194
194 -
 195
195 -
 196
196 -
 197
197 -
 198
198 -
199
-
200
-
201
-
202
-
203
-
204
-
205
-
206
-
207
-
208
-
209
-
210
-
211
-
212
-
213
-
214
-
215
-
216
-
217
-
218
-
219
-
220
-
221
-
222
-
223
-
224
-
225
-
226
-
227
-
228
-
229
-
230
-
231
-
232
-
233
-
234
-
235
-
236
-
237
-
238
-
239
-
240
-
241
-
242
-
243
-
244
-
245
-
246
-
247
-
248
 |
 |

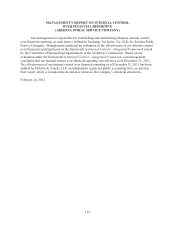
ARIZONA PUBLIC SERVICE COMPANY
NOTES TO CONSOLIDATED FINANCIAL STATEMENTS
163
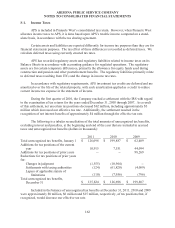
As of the balance sheet date, the tax year ended December 31, 2008 and all subsequent tax
years remain subject to examination by the IRS. With few exceptions, we are no longer subject to
state income tax examinations by tax authorities for years prior to 2006. We do not anticipate that
there will be any significant increases or decreases in our unrecognized tax benefits within the next
twelve months.
We reflect interest and penalties, if any, on unrecognized tax benefits in the statement of
income as income tax expense. The amount of interest recognized in the Statements of Income
related to unrecognized tax benefits was a pre-tax expense of $3 million for 2011, a pre-tax benefit of
$2 million for 2010 and a pre-tax expense of $2 million for 2009.
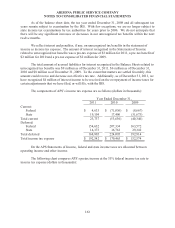
The total amount of accrued liabilities for interest recognized in the Balance Sheets related to
unrecognized tax benefits was $9 million as of December 31, 2011, $6 million as of December 31,
2010 and $8 million as of December 31, 2009. To the extent that matters are settled favorably, this
amount could reverse and decrease our effective tax rate. Additionally, as of December 31, 2011, we
have recognized $4 million of interest income to be received on the overpayment of income taxes for
certain adjustments that we have filed, or will file, with the IRS.
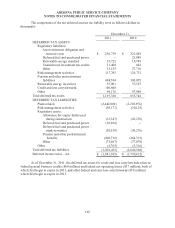
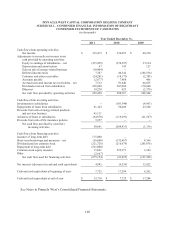
The components of APS’s income tax expense are as follows (dollars in thousands):
Year Ended December 31,
2011 2010 2009
Current:
Federal $ 4,633 $ (71,036) $ (8,667)
State 19,104 17,406 (31,673)
Total current 23,737 (53,630) (40,340)
Deferred:
Federal 154,632 207,334 163,572
State 14,173 16,761 29,342
Total deferred 168,805 224,095 192,914
Total income tax expense $ 192,542 $ 170,465 $ 152,574
On the APS Statements of Income, federal and state income taxes are allocated between
operating income and other income.
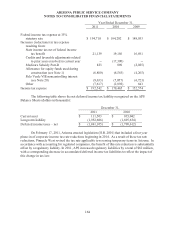
The following chart compares APS’s pretax income at the 35% federal income tax rate to
income tax expense (dollars in thousands):