APS 2011 Annual Report Download - page 96
Download and view the complete annual report
Please find page 96 of the 2011 APS annual report below. You can navigate through the pages in the report by either clicking on the pages listed below, or by using the keyword search tool below to find specific information within the annual report.-
 1
1 -
2
-
3
-
4
-
5
-
6
-
7
-
8
-
9
-
10
-
11
-
12
-
13
-
14
-
15
-
16
-
17
-
18
-
19
-
20
-
21
-
22
-
23
-
24
-
25
-
26
-
27
-
28
-
29
-
30
-
31
-
32
-
33
-
34
-
35
-
36
-
37
-
38
-
39
-
40
-
41
-
42
-
43
-
44
-
45
-
46
-
47
-
48
-
49
-
50
-
51
-
52
-
53
-
54
-
55
-
56
-
57
-
58
-
59
-
60
-
61
-
62
-
63
-
64
-
65
-
66
-
67
-
68
-
69
-
70
-
71
-
72
-
73
-
74
-
75
-
76
-
77
-
78
-
79
-
80
-
81
-
82
-
83
-
84
-
85
-
 86
86 -
 87
87 -
 88
88 -
 89
89 -
 90
90 -
 91
91 -
 92
92 -
 93
93 -
 94
94 -
 95
95 -
 96
96 -
 97
97 -
 98
98 -
 99
99 -
 100
100 -
 101
101 -
 102
102 -
 103
103 -
 104
104 -
 105
105 -
 106
106 -
107
-
108
-
109
-
110
-
111
-
112
-
113
-
114
-
115
-
116
-
117
-
118
-
119
-
120
-
121
-
122
-
123
-
124
-
125
-
126
-
127
-
128
-
129
-
130
-
131
-
132
-
133
-
134
-
135
-
136
-
137
-
138
-
139
-
140
-
141
-
142
-
143
-
144
-
145
-
146
-
147
-
148
-
149
-
150
-
151
-
152
-
153
-
154
-
155
-
156
-
157
-
158
-
159
-
160
-
161
-
162
-
163
-
164
-
165
-
166
-
167
-
168
-
169
-
170
-
171
-
172
-
173
-
174
-
175
-
176
-
177
-
178
-
179
-
180
-
181
-
182
-
183
-
184
-
185
-
186
-
187
-
188
-
189
-
190
-
191
-
192
-
193
-
194
-
195
-
196
-
197
-
198
-
199
-
200
-
201
-
202
-
203
-
204
-
205
-
206
-
207
-
208
-
209
-
210
-
211
-
212
-
213
-
214
-
215
-
216
-
217
-
218
-
219
-
220
-
221
-
222
-
223
-
224
-
225
-
226
-
227
-
228
-
229
-
230
-
231
-
232
-
233
-
234
-
235
-
236
-
237
-
238
-
239
-
240
-
241
-
242
-
243
-
244
-
245
-
246
-
247
-
248
 |
 |

72
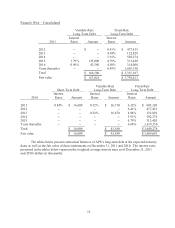
Pinnacle West – Consolidated
Variable-Rate
Long-Term Debt
Fixed-Rate
Long-Term Debt
Interest Interest
2011 Rates Amount Rates Amount
2012 -- $ -- 6.41% $ 477,435
2013 -- -- 4.94% 122,828
2014 -- -- 5.91% 502,274
2015 1.79% 125,000 4.79% 313,420
2016 0.09% 43,580 4.98% 314,000
Years thereafter -- -- 6.49% 1,605,150
Total $ 168,580 $ 3,335,107
Fair value $ 167,018 $ 3,758,811
Short-Term Debt
Variable-Rate
Long-Term Debt
Fixed-Rate
Long-Term Debt
Interest Interest Interest
2010 Rates Amount Rates Amount Rates Amount
2011 0.84% $ 16,600 0.32% $ 26,710 6.32% $ 605,169
2012 -- -- -- -- 6.41% 477,435
2013 -- -- 0.32% 16,870 4.94% 122,828
2014 -- -- -- -- 5.91% 502,274
2015 -- -- -- -- 4.79% 313,420
Years thereafter -- -- -- -- 6.69% 1,619,150
Total
$ 16,600 $ 43,580 $ 3,640,276
Fair value $ 16,600 $ 43,580 $ 3,869,681
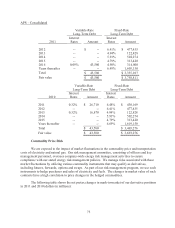
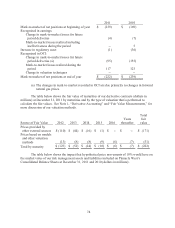
The tables below present contractual balances of APS’s long-term debt at the expected maturity
dates as well as the fair value of those instruments on December 31, 2011 and 2010. The interest rates
presented in the tables below represent the weighted-average interest rates as of December 31, 2011
and 2010 (dollars in thousands):