APS 2011 Annual Report Download - page 36
Download and view the complete annual report
Please find page 36 of the 2011 APS annual report below. You can navigate through the pages in the report by either clicking on the pages listed below, or by using the keyword search tool below to find specific information within the annual report.-
 1
1 -
2
-
3
-
4
-
5
-
6
-
7
-
8
-
9
-
10
-
11
-
12
-
13
-
14
-
15
-
16
-
17
-
18
-
19
-
20
-
21
-
22
-
23
-
24
-
25
-
 26
26 -
 27
27 -
 28
28 -
 29
29 -
 30
30 -
 31
31 -
 32
32 -
 33
33 -
 34
34 -
 35
35 -
 36
36 -
 37
37 -
 38
38 -
 39
39 -
 40
40 -
 41
41 -
 42
42 -
 43
43 -
 44
44 -
 45
45 -
 46
46 -
47
-
48
-
49
-
50
-
51
-
52
-
53
-
54
-
55
-
56
-
57
-
58
-
59
-
60
-
61
-
62
-
63
-
64
-
65
-
66
-
67
-
68
-
69
-
70
-
71
-
72
-
73
-
74
-
75
-
76
-
77
-
78
-
79
-
80
-
81
-
82
-
83
-
84
-
85
-
86
-
87
-
88
-
89
-
90
-
91
-
92
-
93
-
94
-
95
-
96
-
97
-
98
-
99
-
100
-
101
-
102
-
103
-
104
-
105
-
106
-
107
-
108
-
109
-
110
-
111
-
112
-
113
-
114
-
115
-
116
-
117
-
118
-
119
-
120
-
121
-
122
-
123
-
124
-
125
-
126
-
127
-
128
-
129
-
130
-
131
-
132
-
133
-
134
-
135
-
136
-
137
-
138
-
139
-
140
-
141
-
142
-
143
-
144
-
145
-
146
-
147
-
148
-
149
-
150
-
151
-
152
-
153
-
154
-
155
-
156
-
157
-
158
-
159
-
160
-
161
-
162
-
163
-
164
-
165
-
166
-
167
-
168
-
169
-
170
-
171
-
172
-
173
-
174
-
175
-
176
-
177
-
178
-
179
-
180
-
181
-
182
-
183
-
184
-
185
-
186
-
187
-
188
-
189
-
190
-
191
-
192
-
193
-
194
-
195
-
196
-
197
-
198
-
199
-
200
-
201
-
202
-
203
-
204
-
205
-
206
-
207
-
208
-
209
-
210
-
211
-
212
-
213
-
214
-
215
-
216
-
217
-
218
-
219
-
220
-
221
-
222
-
223
-
224
-
225
-
226
-
227
-
228
-
229
-
230
-
231
-
232
-
233
-
234
-
235
-
236
-
237
-
238
-
239
-
240
-
241
-
242
-
243
-
244
-
245
-
246
-
247
-
248
 |
 |

12
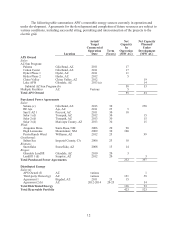
The following table summarizes APS’s renewable energy sources currently in operation and
under development. Agreements for the development and completion of future resources are subject to
various conditions, including successful siting, permitting and interconnection of the projects to the
electric grid.
Location
Actual/
Target
Commercial
Operation
Date
Term
(Years)
Net
Capacity
In
Operation
(MW AC)
Net Capacity
Planned/
Under
Development
(MW AC)
APS Owned
Sola
r
:
AZ Sun Pro
g
ram:
Paloma Gila Bend, AZ 2011 17
Cotton Cente
r
Gila Bend, AZ 2011 17
H
y
de
r
Phase 1 H
y
der, AZ 2011 11
H
y
der Phase 2 H
y
der, AZ 2012 5
Chino Valle
y
Chino Valle
y
, AZ 2012 19
Luke AFB Glendale, AZ 2013 (a) 14
Subtotal AZ Sun Pro
g
ram
(
b
)
50 33
Multiple Facilities AZ Various 5
Total APS Owned 55 33
Purchased Power A
g
reements
Solar:
Solana
(
c
)
Gila Bend, AZ 2013 30 250
RE A
j
o A
j
o, AZ 2011 25 5
Sun E AZ 1 Prescott, AZ 2011 30 10
Solar 1
(
d
)
Tono
p
ah, AZ 2012 30 15
Solar 2
(
d
)
Tono
p
ah, AZ 2013 30 15
Solar 3
(
d
)
Marico
p
a Count
y
, AZ 2013 30 15
Wind:
Ara
g
onne Mesa Santa Rosa, NM 2006 20 90
Hi
g
h Lonesome Mountainair, NM 2009 30 100
Perrin Ranch Wind Williams, AZ 2012 25 99
Geothermal:
Salton Se
a
Im
p
erial Count
y
, CA 2006 23 10
Biomass:
Snowflake Snowflake, AZ 2008 15 14
Bio
g
as:
Glendale Landfill Glendale, AZ 2010 20 3
Landfill 1 (d) Surprise, AZ 2012 20 3
Total Purchased Power Agreements 232 397
Distributed Ener
gy
Sola
r
(
e
)
APS Owned
(f
)
AZ various 1
Third-
p
art
y
Owned
(g
)
AZ various 121 58
A
g
reement 1 Ba
g
dad, AZ 2011 25 15
Agreement 2 (h) AZ 2012-2014 20-25 34
Total Distributed Energy 136 93
Total Renewable Portfolio 423 523