APS 2011 Annual Report Download - page 141
Download and view the complete annual report
Please find page 141 of the 2011 APS annual report below. You can navigate through the pages in the report by either clicking on the pages listed below, or by using the keyword search tool below to find specific information within the annual report.-
 1
1 -
2
-
3
-
4
-
5
-
6
-
7
-
8
-
9
-
10
-
11
-
12
-
13
-
14
-
15
-
16
-
17
-
18
-
19
-
20
-
21
-
22
-
23
-
24
-
25
-
26
-
27
-
28
-
29
-
30
-
31
-
32
-
33
-
34
-
35
-
36
-
37
-
38
-
39
-
40
-
41
-
42
-
43
-
44
-
45
-
46
-
47
-
48
-
49
-
50
-
51
-
52
-
53
-
54
-
55
-
56
-
57
-
58
-
59
-
60
-
61
-
62
-
63
-
64
-
65
-
66
-
67
-
68
-
69
-
70
-
71
-
72
-
73
-
74
-
75
-
76
-
77
-
78
-
79
-
80
-
81
-
82
-
83
-
84
-
85
-
86
-
87
-
88
-
89
-
90
-
91
-
92
-
93
-
94
-
95
-
96
-
97
-
98
-
99
-
100
-
101
-
102
-
103
-
104
-
105
-
106
-
107
-
108
-
109
-
110
-
111
-
112
-
113
-
114
-
115
-
116
-
117
-
118
-
119
-
120
-
121
-
122
-
123
-
124
-
125
-
126
-
127
-
128
-
129
-
130
-
 131
131 -
 132
132 -
 133
133 -
 134
134 -
 135
135 -
 136
136 -
 137
137 -
 138
138 -
 139
139 -
 140
140 -
 141
141 -
 142
142 -
 143
143 -
 144
144 -
 145
145 -
 146
146 -
 147
147 -
 148
148 -
 149
149 -
 150
150 -
 151
151 -
152
-
153
-
154
-
155
-
156
-
157
-
158
-
159
-
160
-
161
-
162
-
163
-
164
-
165
-
166
-
167
-
168
-
169
-
170
-
171
-
172
-
173
-
174
-
175
-
176
-
177
-
178
-
179
-
180
-
181
-
182
-
183
-
184
-
185
-
186
-
187
-
188
-
189
-
190
-
191
-
192
-
193
-
194
-
195
-
196
-
197
-
198
-
199
-
200
-
201
-
202
-
203
-
204
-
205
-
206
-
207
-
208
-
209
-
210
-
211
-
212
-
213
-
214
-
215
-
216
-
217
-
218
-
219
-
220
-
221
-
222
-
223
-
224
-
225
-
226
-
227
-
228
-
229
-
230
-
231
-
232
-
233
-
234
-
235
-
236
-
237
-
238
-
239
-
240
-
241
-
242
-
243
-
244
-
245
-
246
-
247
-
248
 |
 |

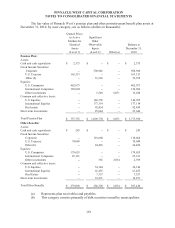
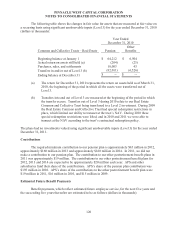
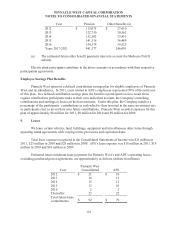
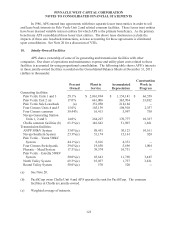
PINNACLE WEST CAPITAL CORPORATION
NOTES TO CONSOLIDATED FINANCIAL STATEMENTS
116
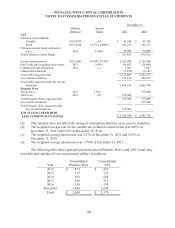
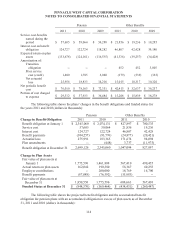
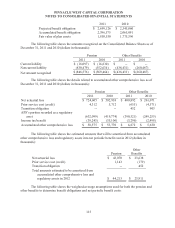
Benefit Obligations
As of December 31,
Benefit Costs
For the Years Ended December 31,
2011 2010 2011 2010 2009
Discount rate-pension 4.42% 5.31% 5.31% 5.90% 6.11%
Discount rate-other benefits 4.59% 5.49% 5.49% 6.00% 6.13%
Rate of compensation
increase 4.00% 4.00% 4.00% 4.00% 4.00%
Expected long-term return
on plan assets N/A N/A 7.75% 8.25% 8.25%
Initial health care cost trend
rate 7.50% 8.00% 8.00% 8.00% 8.00%
Ultimate health care cost
trend rate 5.00% 5.00% 5.00% 5.00% 5.00%
Number of years to ultimate
trend rate 4 4 4 4 4
In selecting the pretax expected long-term rate of return on plan assets we consider past
performance and economic forecasts for the types of investments held by the plan. For the year 2012,
we are assuming a 7.75% long-term rate of return on plan assets, which we believe is reasonable given
our asset allocation in relation to historical and expected performance.
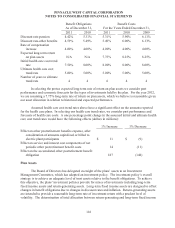
Assumed health care cost trend rates above have a significant effect on the amounts reported
for the health care plans. In selecting our health care trend rates, we consider past performance and
forecasts of health care costs. A one percentage point change in the assumed initial and ultimate health
care cost trend rates would have the following effects (dollars in millions):
1% Increase 1% Decrease
Effect on other postretirement benefits expense, after
consideration of amounts capitalized or billed to
electric plant participants $ 11 $ (9)
Effect on service and interest cost components of net
periodic other postretirement benefit costs 14 (11)
Effect on the accumulated other postretirement benefit
obligation 187 (148)
Plan Assets
The Board of Directors has delegated oversight of the plans’ assets to an Investment
Management Committee, which has adopted an investment policy. The investment policy’s overall
strategy is to achieve an adequate level of trust assets relative to the benefit obligations. To achieve
this objective, the plans’ investment policies provide for mixes of investments including long-term
fixed income assets and return-generating assets. Long-term fixed income assets are designed to offset
changes in benefit obligations due to changes in discount rates and inflation. Return-generating assets
are intended to provide a reasonable long-term rate of investment return with a prudent level of
volatility. The determination of total allocation between return-generating and long-term fixed income