APS 2011 Annual Report Download - page 191
Download and view the complete annual report
Please find page 191 of the 2011 APS annual report below. You can navigate through the pages in the report by either clicking on the pages listed below, or by using the keyword search tool below to find specific information within the annual report.-
 1
1 -
2
-
3
-
4
-
5
-
6
-
7
-
8
-
9
-
10
-
11
-
12
-
13
-
14
-
15
-
16
-
17
-
18
-
19
-
20
-
21
-
22
-
23
-
24
-
25
-
26
-
27
-
28
-
29
-
30
-
31
-
32
-
33
-
34
-
35
-
36
-
37
-
38
-
39
-
40
-
41
-
42
-
43
-
44
-
45
-
46
-
47
-
48
-
49
-
50
-
51
-
52
-
53
-
54
-
55
-
56
-
57
-
58
-
59
-
60
-
61
-
62
-
63
-
64
-
65
-
66
-
67
-
68
-
69
-
70
-
71
-
72
-
73
-
74
-
75
-
76
-
77
-
78
-
79
-
80
-
81
-
82
-
83
-
84
-
85
-
86
-
87
-
88
-
89
-
90
-
91
-
92
-
93
-
94
-
95
-
96
-
97
-
98
-
99
-
100
-
101
-
102
-
103
-
104
-
105
-
106
-
107
-
108
-
109
-
110
-
111
-
112
-
113
-
114
-
115
-
116
-
117
-
118
-
119
-
120
-
121
-
122
-
123
-
124
-
125
-
126
-
127
-
128
-
129
-
130
-
131
-
132
-
133
-
134
-
135
-
136
-
137
-
138
-
139
-
140
-
141
-
142
-
143
-
144
-
145
-
146
-
147
-
148
-
149
-
150
-
151
-
152
-
153
-
154
-
155
-
156
-
157
-
158
-
159
-
160
-
161
-
162
-
163
-
164
-
165
-
166
-
167
-
168
-
169
-
170
-
171
-
172
-
173
-
174
-
175
-
176
-
177
-
178
-
179
-
180
-
 181
181 -
 182
182 -
 183
183 -
 184
184 -
 185
185 -
 186
186 -
 187
187 -
 188
188 -
 189
189 -
 190
190 -
 191
191 -
 192
192 -
 193
193 -
 194
194 -
 195
195 -
 196
196 -
 197
197 -
 198
198 -
 199
199 -
 200
200 -
 201
201 -
202
-
203
-
204
-
205
-
206
-
207
-
208
-
209
-
210
-
211
-
212
-
213
-
214
-
215
-
216
-
217
-
218
-
219
-
220
-
221
-
222
-
223
-
224
-
225
-
226
-
227
-
228
-
229
-
230
-
231
-
232
-
233
-
234
-
235
-
236
-
237
-
238
-
239
-
240
-
241
-
242
-
243
-
244
-
245
-
246
-
247
-
248
 |
 |

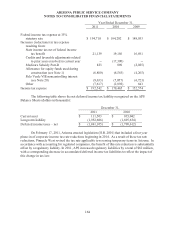
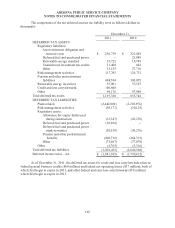
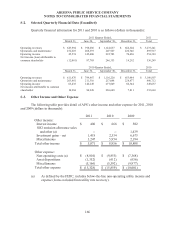
ARIZONA PUBLIC SERVICE COMPANY
NOTES TO CONSOLIDATED FINANCIAL STATEMENTS
166
S-2. Selected Quarterly Financial Data (Unaudited)
Quarterly financial information for 2011 and 2010 is as follows (dollars in thousands):
2011 Quarter Ended, 2011
March 31, June 30, September 30, December 31, Total
Operating revenues $ 647,994 $ 798,686 $ 1,124,057 $ 666,504 $ 3,237,241
Operations and maintenance 252,607 208,597 207,967 226,746 895,917
Operating income 45,574 145,400 292,783 70,626 554,383
Net income (loss) attributable to
common shareholder (12,081) 87,705 246,333 14,292 336,249
2010 Quarter Ended, 2010
March 31, June 30, September 30, December 31, Total
Operating revenues $ 611,476 $ 799,467 $ 1,116,220 $ 653,644 $ 3,180,807
Operations and maintenance 203,881 211,310 217,044 228,477 860,712
Operating income 65,435 146,249 277,009 60,344 549,037
Net income attributable to common
shareholder 10,984 90,220 226,648 7,811 335,663
S-3. Other Income and Other Expense
The following table provides detail of APS’s other income and other expense for 2011, 2010
and 2009 (dollars in thousands):
2011 2010 2009
Other income:
Interest income $ 406 $ 668 $ 502
SO2 emission allowance sales
and other (a)
--
--
1,439
Investment gains – net 1,418 2,334 6,673
Miscellaneous 3,247 5,954 2,194
Total other income $ 5,071 $ 8,956 $ 10,808
Other expense:
Non-operating costs (a) $ (8,810) $ (9,855) $ (7,368)
Asset dispositions (1,352) (612) (656)
Miscellaneous (5,166) (5,392) (9,977)
Total other expense $ (15,328) $ (15,859) $ (18,001)
(a) As defined by the FERC, includes below-the-line non-operating utility income and
expense (items excluded from utility rate recovery).