APS 2011 Annual Report Download - page 169
Download and view the complete annual report
Please find page 169 of the 2011 APS annual report below. You can navigate through the pages in the report by either clicking on the pages listed below, or by using the keyword search tool below to find specific information within the annual report.-
 1
1 -
2
-
3
-
4
-
5
-
6
-
7
-
8
-
9
-
10
-
11
-
12
-
13
-
14
-
15
-
16
-
17
-
18
-
19
-
20
-
21
-
22
-
23
-
24
-
25
-
26
-
27
-
28
-
29
-
30
-
31
-
32
-
33
-
34
-
35
-
36
-
37
-
38
-
39
-
40
-
41
-
42
-
43
-
44
-
45
-
46
-
47
-
48
-
49
-
50
-
51
-
52
-
53
-
54
-
55
-
56
-
57
-
58
-
59
-
60
-
61
-
62
-
63
-
64
-
65
-
66
-
67
-
68
-
69
-
70
-
71
-
72
-
73
-
74
-
75
-
76
-
77
-
78
-
79
-
80
-
81
-
82
-
83
-
84
-
85
-
86
-
87
-
88
-
89
-
90
-
91
-
92
-
93
-
94
-
95
-
96
-
97
-
98
-
99
-
100
-
101
-
102
-
103
-
104
-
105
-
106
-
107
-
108
-
109
-
110
-
111
-
112
-
113
-
114
-
115
-
116
-
117
-
118
-
119
-
120
-
121
-
122
-
123
-
124
-
125
-
126
-
127
-
128
-
129
-
130
-
131
-
132
-
133
-
134
-
135
-
136
-
137
-
138
-
139
-
140
-
141
-
142
-
143
-
144
-
145
-
146
-
147
-
148
-
149
-
150
-
151
-
152
-
153
-
154
-
155
-
156
-
157
-
158
-
 159
159 -
 160
160 -
 161
161 -
 162
162 -
 163
163 -
 164
164 -
 165
165 -
 166
166 -
 167
167 -
 168
168 -
 169
169 -
 170
170 -
 171
171 -
 172
172 -
 173
173 -
 174
174 -
 175
175 -
 176
176 -
 177
177 -
 178
178 -
 179
179 -
180
-
181
-
182
-
183
-
184
-
185
-
186
-
187
-
188
-
189
-
190
-
191
-
192
-
193
-
194
-
195
-
196
-
197
-
198
-
199
-
200
-
201
-
202
-
203
-
204
-
205
-
206
-
207
-
208
-
209
-
210
-
211
-
212
-
213
-
214
-
215
-
216
-
217
-
218
-
219
-
220
-
221
-
222
-
223
-
224
-
225
-
226
-
227
-
228
-
229
-
230
-
231
-
232
-
233
-
234
-
235
-
236
-
237
-
238
-
239
-
240
-
241
-
242
-
243
-
244
-
245
-
246
-
247
-
248
 |
 |

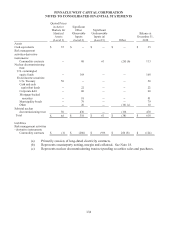
PINNACLE WEST CAPITAL CORPORATION
NOTES TO CONSOLIDATED FINANCIAL STATEMENTS
144
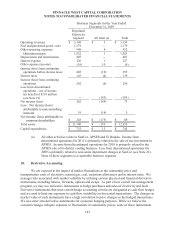
may not meet the specific hedge accounting requirements and are not designated as accounting
hedges. Contracts that have the same terms (quantities and delivery points) and for which power does
not flow are netted, which reduces both revenues and fuel and purchased power costs in our
Consolidated Statements of Income, but does not impact our financial condition, net income or cash
flows.
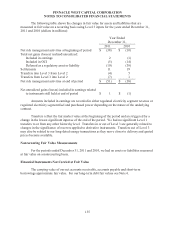
Our derivative instruments, excluding those qualifying for a scope exception, are recorded on
the balance sheet as an asset or liability and are measured at fair value; see Note 14 for a discussion
of fair value measurements. Derivative instruments may qualify for the normal purchases and
normal sales scope exception if they require physical delivery and the quantities represent those
transacted in the normal course of business. Derivative instruments qualifying for the normal
purchase and sales scope exception are accounted for under the accrual method of accounting and
excluded from our derivative instrument discussion and disclosures below.
Hedge effectiveness is the degree to which the derivative instrument contract and the hedged
item are correlated and is measured based on the relative changes in fair value of the derivative
instrument contract and the hedged item over time. We assess hedge effectiveness both at inception
and on a continuing basis. These assessments exclude the time value of certain options. For
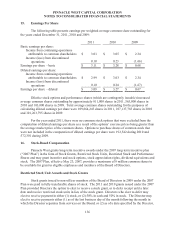
accounting hedges that are deemed an effective hedge, the effective portion of the gain or loss on the
derivative instrument is reported as a component of accumulated other comprehensive income
(“AOCI”) and reclassified into earnings in the same period during which the hedged transaction
affects earnings. We recognize in current earnings, subject to the PSA, the gains and losses
representing hedge ineffectiveness, and the gains and losses on any hedge components which are
excluded from our effectiveness assessment. As of December 31, 2011, we hedged the majority of
certain exposures to the price variability of commodities for a maximum of 39 months.
APS defers for future rate treatment approximately 90% of unrealized gains and losses on
certain derivatives, pursuant to the PSA mechanism, that would otherwise be recognized in income.
Realized gains and losses on derivatives are deferred in accordance with the PSA to the extent the
amounts are above or below the Base Fuel Rate (see Note 3). Gains and losses from derivatives in
the following tables represent the amounts reflected in income before the effect of PSA deferrals.
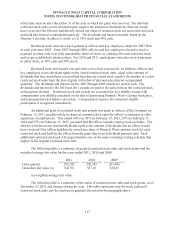
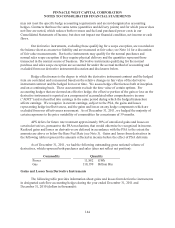
As of December 31, 2011, we had the following outstanding gross notional volume of
derivatives, which represent both purchases and sales (does not reflect net position):
Commodity Quantity
Power 11,882 GWh
Gas 118,199 Billion Btu
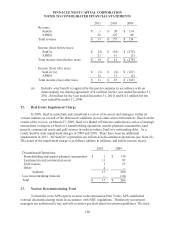
Gains and Losses from Derivative Instruments
The following table provides information about gains and losses from derivative instruments
in designated cash flow accounting hedges during the year ended December 31, 2011 and
December 31, 2010 (dollars in thousands):