APS 2011 Annual Report Download - page 88
Download and view the complete annual report
Please find page 88 of the 2011 APS annual report below. You can navigate through the pages in the report by either clicking on the pages listed below, or by using the keyword search tool below to find specific information within the annual report.-
 1
1 -
2
-
3
-
4
-
5
-
6
-
7
-
8
-
9
-
10
-
11
-
12
-
13
-
14
-
15
-
16
-
17
-
18
-
19
-
20
-
21
-
22
-
23
-
24
-
25
-
26
-
27
-
28
-
29
-
30
-
31
-
32
-
33
-
34
-
35
-
36
-
37
-
38
-
39
-
40
-
41
-
42
-
43
-
44
-
45
-
46
-
47
-
48
-
49
-
50
-
51
-
52
-
53
-
54
-
55
-
56
-
57
-
58
-
59
-
60
-
61
-
62
-
63
-
64
-
65
-
66
-
67
-
68
-
69
-
70
-
71
-
72
-
73
-
74
-
75
-
76
-
77
-
 78
78 -
 79
79 -
 80
80 -
 81
81 -
 82
82 -
 83
83 -
 84
84 -
 85
85 -
 86
86 -
 87
87 -
 88
88 -
 89
89 -
 90
90 -
 91
91 -
 92
92 -
 93
93 -
 94
94 -
 95
95 -
 96
96 -
 97
97 -
 98
98 -
99
-
100
-
101
-
102
-
103
-
104
-
105
-
106
-
107
-
108
-
109
-
110
-
111
-
112
-
113
-
114
-
115
-
116
-
117
-
118
-
119
-
120
-
121
-
122
-
123
-
124
-
125
-
126
-
127
-
128
-
129
-
130
-
131
-
132
-
133
-
134
-
135
-
136
-
137
-
138
-
139
-
140
-
141
-
142
-
143
-
144
-
145
-
146
-
147
-
148
-
149
-
150
-
151
-
152
-
153
-
154
-
155
-
156
-
157
-
158
-
159
-
160
-
161
-
162
-
163
-
164
-
165
-
166
-
167
-
168
-
169
-
170
-
171
-
172
-
173
-
174
-
175
-
176
-
177
-
178
-
179
-
180
-
181
-
182
-
183
-
184
-
185
-
186
-
187
-
188
-
189
-
190
-
191
-
192
-
193
-
194
-
195
-
196
-
197
-
198
-
199
-
200
-
201
-
202
-
203
-
204
-
205
-
206
-
207
-
208
-
209
-
210
-
211
-
212
-
213
-
214
-
215
-
216
-
217
-
218
-
219
-
220
-
221
-
222
-
223
-
224
-
225
-
226
-
227
-
228
-
229
-
230
-
231
-
232
-
233
-
234
-
235
-
236
-
237
-
238
-
239
-
240
-
241
-
242
-
243
-
244
-
245
-
246
-
247
-
248
 |
 |
64
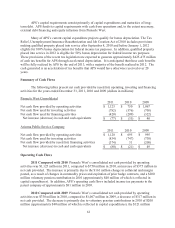
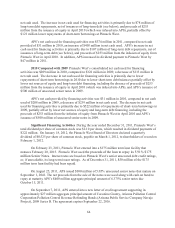
net cash used. The increase in net cash used for financing activities is primarily due to $78 million of
long-term debt repayments, net of issuances of long-term debt (see below), and proceeds of $253
million from the issuance of equity in April 2010 (which was infused into APS), partially offset by
$121 million lower repayments of short-term borrowings at Pinnacle West.
APS’s net cash used for financing activities was $374 million in 2011, compared to net cash
provided of $31 million in 2010, an increase of $405 million in net cash used. APS’s increase in net
cash used for financing activities is primarily due to $107 million of long-term debt repayments, net of
issuances of long-term debt (see below), and proceeds of $253 million from the infusion of equity from
Pinnacle West in April 2010. In addition, APS increased its dividend payment to Pinnacle West by
$47 million in 2011.
2010 Compared with 2009 Pinnacle West’s consolidated net cash used for financing
activities was $209 million in 2010, compared to $322 million in 2009, a decrease of $113 million in
net cash used. The decrease in net cash used for financing activities is primarily due to lower
repayments of short-term borrowings in 2010 due to lower short-term debt balances partially offset by
lower net sources of equity and long-term debt financing, including the absence of proceeds of $253
million from the issuance of equity in April 2010 (which was infused into APS), and APS’s issuance of
$500 million of unsecured senior notes in 2009.
APS’s net cash provided by financing activities was $31 million in 2010, compared to net cash
used of $208 million in 2009, a decrease of $239 million in net cash used. The decrease in net cash
used for financing activities is primarily due to $522 million of repayments of short-term borrowings in
2009, partially offset by lower net sources of equity and long-term debt financing, including the
proceeds of $253 million from the infusion of equity from Pinnacle West in April 2010 and APS’s
issuance of $500 million of unsecured senior notes in 2009.
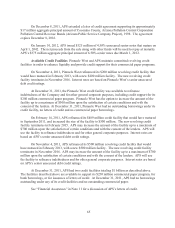
Significant Financing Activities During the year ended December 31, 2011, Pinnacle West’s
total dividend per share of common stock was $2.10 per share, which resulted in dividend payments of
$222 million. On January 18, 2012, the Pinnacle West Board of Directors declared a quarterly
dividend of $0.525 per share of common stock, payable on March 1, 2012, to shareholders of record on
February 1, 2012.
On February 23, 2011, Pinnacle West entered into a $175 million term loan facility that
matures February 20, 2015. Pinnacle West used the proceeds of the loan to repay its 5.91% $175
million Senior Notes. Interest rates are based on Pinnacle West’s senior unsecured debt credit ratings,
or, if unavailable, its long-term issuer ratings. As of December 31, 2011, $50 million of the $175
million term loan facility had been repaid.
On August 25, 2011, APS issued $300 million of 5.05% unsecured senior notes that mature on
September 1, 2041. The net proceeds from the sale of the notes were used along with cash on hand to
repay at maturity APS’s $400 million aggregate principal amount of 6.375% senior notes due
October 15, 2011.
On September 7, 2011, APS entered into a new letter of credit agreement supporting its
approximately $27 million aggregate principal amount of Coconino County, Arizona Pollution Control
Corporation Pollution Control Revenue Refunding Bonds (Arizona Public Service Company Navajo
Project), 2009 Series B. The agreement expires September 22, 2016.