APS 2011 Annual Report Download - page 154
Download and view the complete annual report
Please find page 154 of the 2011 APS annual report below. You can navigate through the pages in the report by either clicking on the pages listed below, or by using the keyword search tool below to find specific information within the annual report.-
 1
1 -
2
-
3
-
4
-
5
-
6
-
7
-
8
-
9
-
10
-
11
-
12
-
13
-
14
-
15
-
16
-
17
-
18
-
19
-
20
-
21
-
22
-
23
-
24
-
25
-
26
-
27
-
28
-
29
-
30
-
31
-
32
-
33
-
34
-
35
-
36
-
37
-
38
-
39
-
40
-
41
-
42
-
43
-
44
-
45
-
46
-
47
-
48
-
49
-
50
-
51
-
52
-
53
-
54
-
55
-
56
-
57
-
58
-
59
-
60
-
61
-
62
-
63
-
64
-
65
-
66
-
67
-
68
-
69
-
70
-
71
-
72
-
73
-
74
-
75
-
76
-
77
-
78
-
79
-
80
-
81
-
82
-
83
-
84
-
85
-
86
-
87
-
88
-
89
-
90
-
91
-
92
-
93
-
94
-
95
-
96
-
97
-
98
-
99
-
100
-
101
-
102
-
103
-
104
-
105
-
106
-
107
-
108
-
109
-
110
-
111
-
112
-
113
-
114
-
115
-
116
-
117
-
118
-
119
-
120
-
121
-
122
-
123
-
124
-
125
-
126
-
127
-
128
-
129
-
130
-
131
-
132
-
133
-
134
-
135
-
136
-
137
-
138
-
139
-
140
-
141
-
142
-
143
-
 144
144 -
 145
145 -
 146
146 -
 147
147 -
 148
148 -
 149
149 -
 150
150 -
 151
151 -
 152
152 -
 153
153 -
 154
154 -
 155
155 -
 156
156 -
 157
157 -
 158
158 -
 159
159 -
 160
160 -
 161
161 -
 162
162 -
 163
163 -
 164
164 -
165
-
166
-
167
-
168
-
169
-
170
-
171
-
172
-
173
-
174
-
175
-
176
-
177
-
178
-
179
-
180
-
181
-
182
-
183
-
184
-
185
-
186
-
187
-
188
-
189
-
190
-
191
-
192
-
193
-
194
-
195
-
196
-
197
-
198
-
199
-
200
-
201
-
202
-
203
-
204
-
205
-
206
-
207
-
208
-
209
-
210
-
211
-
212
-
213
-
214
-
215
-
216
-
217
-
218
-
219
-
220
-
221
-
222
-
223
-
224
-
225
-
226
-
227
-
228
-
229
-
230
-
231
-
232
-
233
-
234
-
235
-
236
-
237
-
238
-
239
-
240
-
241
-
242
-
243
-
244
-
245
-
246
-
247
-
248
 |
 |

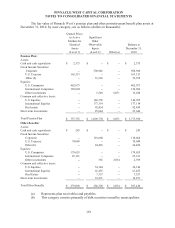
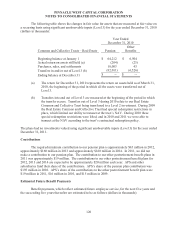
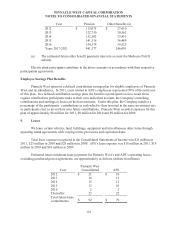
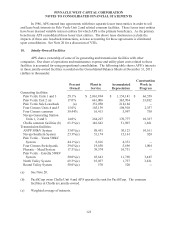
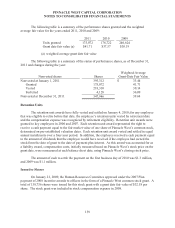
PINNACLE WEST CAPITAL CORPORATION
NOTES TO CONSOLIDATED FINANCIAL STATEMENTS
129
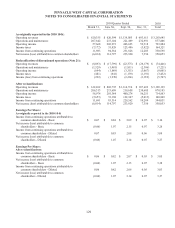
2010 Quarter Ended 2010
March 31, June 30, Sept. 30, Dec. 31, Total
As originally reported in the 2010 10-K:
Operating revenues $ 620,355 $ 820,594 $ 1,139,085 $ 683,611 $ 3,263,645
Operations and maintenance 207,842 215,104 221,469 232,991 877,406
Operating income 57,668 203,273 403,625 59,318 723,884
Income taxes (7,172) 51,829 123,486 (3,822) 164,321
Income from continuing operations 11,983 94,584 231,828 12,203 350,598
Net income (loss) attributable to common shareholders (6,014) 114,797 233,920 7,350 350,053
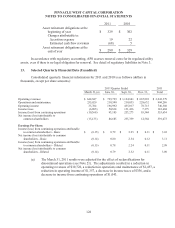
Reclassification of discontinued operations (Note 21):
Operating revenues $ (8,093) $ (17,799) $ (22,375) $ (26,179) $ (74,446)
Operations and maintenance (1,529) (1,495) (1,811) (2,386) (7,221)
Operating income (694) (1,889) (3,351) (3,067) (9,001)
Income taxes (481) (641) (1,139) (1,191) (3,452)
Income (loss) from continuing operations (292) (1,270) (2,266) (1,919) (5,747)
After reclassifications:
Operating revenues $ 612,262 $ 802,795 $ 1,116,710 $ 657,432 $ 3,189,199
Operations and maintenance 206,313 213,609 219,658 230,605 870,185
Operating income 56,974 201,384 400,274 56,251 714,883
Income taxes (7,653) 51,188 122,347 (5,013) 160,869
Income from continuing operations 11,691 93,314 229,562 10,284 344,851
Net income (loss) attributable to common shareholders (6,014) 114,797 233,920 7,350 350,053
Earnings Per Share:
As originally reported in the 2010 10-K
Income from continuing operations attributable to
common shareholders - Basic
$ 0.07 $ 0.84 $ 2.09 $ 0.07 $ 3.10
Net income (loss) attributable to common
shareholders - Basic
(0.06) 1.07 2.15 0.07 3.28
Income from continuing operations attributable to
common shareholders - Diluted 0.07 0.83 2.08 0.06 3.08
Net income (loss) attributable to common
shareholders - Diluted
(0.06) 1.07 2.14 0.07 3.27
Earnings Per Share:
After reclassifications:
Income from continuing operations attributable to
common shareholders - Basic
$ 0.06 $ 0.82 $ 2.07 $ 0.05 $ 3.05
Net income (loss) attributable to common
shareholders - Basic
(0.06) 1.07 2.15 0.07 3.28
Income from continuing operations attributable to
common shareholders - Diluted 0.06 0.82 2.06 0.05 3.03
Net income (loss) attributable to common
shareholders - Diluted
(0.06) 1.07 2.14 0.07 3.27