APS 2011 Annual Report Download - page 171
Download and view the complete annual report
Please find page 171 of the 2011 APS annual report below. You can navigate through the pages in the report by either clicking on the pages listed below, or by using the keyword search tool below to find specific information within the annual report.-
 1
1 -
2
-
3
-
4
-
5
-
6
-
7
-
8
-
9
-
10
-
11
-
12
-
13
-
14
-
15
-
16
-
17
-
18
-
19
-
20
-
21
-
22
-
23
-
24
-
25
-
26
-
27
-
28
-
29
-
30
-
31
-
32
-
33
-
34
-
35
-
36
-
37
-
38
-
39
-
40
-
41
-
42
-
43
-
44
-
45
-
46
-
47
-
48
-
49
-
50
-
51
-
52
-
53
-
54
-
55
-
56
-
57
-
58
-
59
-
60
-
61
-
62
-
63
-
64
-
65
-
66
-
67
-
68
-
69
-
70
-
71
-
72
-
73
-
74
-
75
-
76
-
77
-
78
-
79
-
80
-
81
-
82
-
83
-
84
-
85
-
86
-
87
-
88
-
89
-
90
-
91
-
92
-
93
-
94
-
95
-
96
-
97
-
98
-
99
-
100
-
101
-
102
-
103
-
104
-
105
-
106
-
107
-
108
-
109
-
110
-
111
-
112
-
113
-
114
-
115
-
116
-
117
-
118
-
119
-
120
-
121
-
122
-
123
-
124
-
125
-
126
-
127
-
128
-
129
-
130
-
131
-
132
-
133
-
134
-
135
-
136
-
137
-
138
-
139
-
140
-
141
-
142
-
143
-
144
-
145
-
146
-
147
-
148
-
149
-
150
-
151
-
152
-
153
-
154
-
155
-
156
-
157
-
158
-
159
-
160
-
 161
161 -
 162
162 -
 163
163 -
 164
164 -
 165
165 -
 166
166 -
 167
167 -
 168
168 -
 169
169 -
 170
170 -
 171
171 -
 172
172 -
 173
173 -
 174
174 -
 175
175 -
 176
176 -
 177
177 -
 178
178 -
 179
179 -
 180
180 -
 181
181 -
182
-
183
-
184
-
185
-
186
-
187
-
188
-
189
-
190
-
191
-
192
-
193
-
194
-
195
-
196
-
197
-
198
-
199
-
200
-
201
-
202
-
203
-
204
-
205
-
206
-
207
-
208
-
209
-
210
-
211
-
212
-
213
-
214
-
215
-
216
-
217
-
218
-
219
-
220
-
221
-
222
-
223
-
224
-
225
-
226
-
227
-
228
-
229
-
230
-
231
-
232
-
233
-
234
-
235
-
236
-
237
-
238
-
239
-
240
-
241
-
242
-
243
-
244
-
245
-
246
-
247
-
248
 |
 |

PINNACLE WEST CAPITAL CORPORATION
NOTES TO CONSOLIDATED FINANCIAL STATEMENTS
146
Commodity Contracts
Designated
as Hedging
Instruments
Not
Designated
as Hedging
Instruments
Margin and
Collateral
Provided to
Counterparties
Collateral
Provided from
Counterparties
(a) Other (b) Total
Current Assets $ 7,287 $ 76,162 $ 1,630 $ -- $ (54,815) $ 30,264
Investments and Other Assets 3,804 58,273 -- -- (12,755) 49,322
Total Assets 11,091 134,435 1,630 -- (67,570) 79,586
Current Liabilities (82,195) (124,028) 107,228 (11,145) 56,172 (53,968)
Deferred Credits and Other (68,137) (92,880) 65,768 -- 12,754 (82,495)
Total Liabilities (150,332) (216,908) 172,996 (11,145) 68,926 (136,463)
Total Derivative Instruments $ (139,241) $ (82,473) $ 174,626 $ (11,145) $ 1,356 $ (56,877)
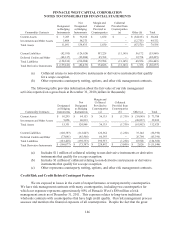
(a) Collateral relates to non-derivative instruments or derivative instruments that qualify
for a scope exception.
(b) Other represents counterparty netting, options, and other risk management contracts.
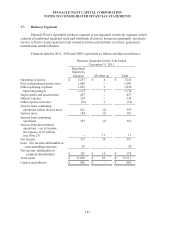
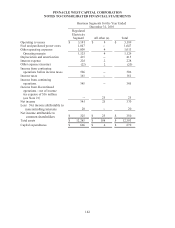
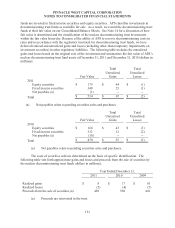
The following table provides information about the fair value of our risk management
activities reported on a gross basis at December 31, 2010 (dollars in thousands):
Commodity Contracts
Designated
as Hedging
Instruments
Not
Designated
as Hedging
Instruments
Margin and
Collateral
Provided to
Counterparties
(a)
Collateral
Provided from
Counterparties
(b) Other (c) Total
Current Assets $ 10,295 $ 64,153 $ 36,135 $ (1,750) $ (35,045) $ 73,788
Investments and Other Assets 5,056 60,813 -- -- (26,837) 39,032
Total Assets 15,351 124,966 36,135 (1,750) (61,882) 112,820
Current Liabilities (108,387) (112,847) 126,364 (1,250) 37,144 (58,976)
Deferred Credits and Other (73,041) (85,506) 66,393 -- 26,764 (65,390)
Total Liabilities (181,428) (198,353) 192,757 (1,250) 63,908 (124,366)
Total Derivative Instruments $ (166,077) $ (73,387) $ 228,892 $ (3,000) $ 2,026 $ (11,546)
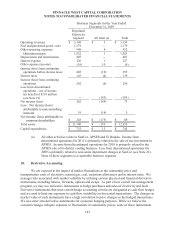
(a) Includes $11 million of collateral relating to non-derivative instruments or derivative
instruments that qualify for a scope exception.
(b) Includes $1 million of collateral relating to non-derivative instruments or derivative
instruments that qualify for a scope exception.
(c) Other represents counterparty netting, options, and other risk management contracts.
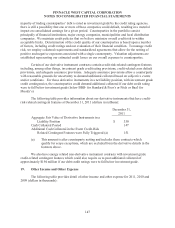
Credit Risk and Credit Related Contingent Features
We are exposed to losses in the event of nonperformance or nonpayment by counterparties.
We have risk management contracts with many counterparties, including two counterparties for
which our exposure represents approximately 80% of Pinnacle West’s $80 million of risk
management assets as of December 31, 2011. This exposure relates to long-term traditional
wholesale contracts with counterparties that have high credit quality. Our risk management process
assesses and monitors the financial exposure of all counterparties. Despite the fact that the great