APS 2011 Annual Report Download - page 87
Download and view the complete annual report
Please find page 87 of the 2011 APS annual report below. You can navigate through the pages in the report by either clicking on the pages listed below, or by using the keyword search tool below to find specific information within the annual report.-
 1
1 -
2
-
3
-
4
-
5
-
6
-
7
-
8
-
9
-
10
-
11
-
12
-
13
-
14
-
15
-
16
-
17
-
18
-
19
-
20
-
21
-
22
-
23
-
24
-
25
-
26
-
27
-
28
-
29
-
30
-
31
-
32
-
33
-
34
-
35
-
36
-
37
-
38
-
39
-
40
-
41
-
42
-
43
-
44
-
45
-
46
-
47
-
48
-
49
-
50
-
51
-
52
-
53
-
54
-
55
-
56
-
57
-
58
-
59
-
60
-
61
-
62
-
63
-
64
-
65
-
66
-
67
-
68
-
69
-
70
-
71
-
72
-
73
-
74
-
75
-
76
-
 77
77 -
 78
78 -
 79
79 -
 80
80 -
 81
81 -
 82
82 -
 83
83 -
 84
84 -
 85
85 -
 86
86 -
 87
87 -
 88
88 -
 89
89 -
 90
90 -
 91
91 -
 92
92 -
 93
93 -
 94
94 -
 95
95 -
 96
96 -
 97
97 -
98
-
99
-
100
-
101
-
102
-
103
-
104
-
105
-
106
-
107
-
108
-
109
-
110
-
111
-
112
-
113
-
114
-
115
-
116
-
117
-
118
-
119
-
120
-
121
-
122
-
123
-
124
-
125
-
126
-
127
-
128
-
129
-
130
-
131
-
132
-
133
-
134
-
135
-
136
-
137
-
138
-
139
-
140
-
141
-
142
-
143
-
144
-
145
-
146
-
147
-
148
-
149
-
150
-
151
-
152
-
153
-
154
-
155
-
156
-
157
-
158
-
159
-
160
-
161
-
162
-
163
-
164
-
165
-
166
-
167
-
168
-
169
-
170
-
171
-
172
-
173
-
174
-
175
-
176
-
177
-
178
-
179
-
180
-
181
-
182
-
183
-
184
-
185
-
186
-
187
-
188
-
189
-
190
-
191
-
192
-
193
-
194
-
195
-
196
-
197
-
198
-
199
-
200
-
201
-
202
-
203
-
204
-
205
-
206
-
207
-
208
-
209
-
210
-
211
-
212
-
213
-
214
-
215
-
216
-
217
-
218
-
219
-
220
-
221
-
222
-
223
-
224
-
225
-
226
-
227
-
228
-
229
-
230
-
231
-
232
-
233
-
234
-
235
-
236
-
237
-
238
-
239
-
240
-
241
-
242
-
243
-
244
-
245
-
246
-
247
-
248
 |
 |

63
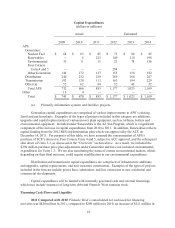
Capital Expenditures
(dollars in millions)
Actual Estimated
2009 2010 2011 2012 2013 2014
APS
Generation:
Nuclear Fuel $ 64 $ 63 $ 85 $ 72 $ 80 $ 85
Renewables -- 6 225 149 218 198
Environmental 33 11 15 23 74 156
Four Corners
Units 4 and 5 -- -- -- 294 -- --
Other Generation 144 172 127 155 158 182
Distribution 246 232 238 269 268 267
Transmission 193 120 111 163 184 229
Other (a) 52 62 84 52 43 52
Total APS 732 666 885 1,177 1,025 1,169
Other 13 4 -- -- -- --
Total $ 745 $ 670 $ 885 $ 1,177 $ 1,025 $ 1,169
(a) Primarily information systems and facilities projects.
Generation capital expenditures are comprised of various improvements to APS’s existing
fossil and nuclear plants. Examples of the types of projects included in this category are additions,
upgrades and capital replacements of various power plant equipment, such as turbines, boilers and
environmental equipment. Included under Renewables is the AZ Sun Program, which is a significant
component of the increase in capital expenditures from 2010 to 2011. In addition, Renewables reflects
capital funding from the 2012 RES implementation plan which was approved by the ACC on
December 14, 2011. For purposes of this table, we have assumed the consummation of APS’s
purchase of SCE’s interest in Four Corners Units 4 and 5, subject to ACC approval, and the subsequent
shut down of Units 1-3, as discussed in the “Overview” section above. As a result, we included the
$294 million purchase price plus adjustments under Generation and have not included environmental
expenditures for Units 1-3. We are also monitoring the status of certain environmental matters, which,
depending on their final outcome, could require modification to our environmental expenditures.
Distribution and transmission capital expenditures are comprised of infrastructure additions
and upgrades, capital replacements, and new customer construction. Examples of the types of projects
included in the forecast include power lines, substations, and line extensions to new residential and
commercial developments.
Capital expenditures will be funded with internally generated cash and external financings,
which may include issuances of long-term debt and Pinnacle West common stock.
Financing Cash Flows and Liquidity
2011 Compared with 2010 Pinnacle West’s consolidated net cash used for financing
activities was $420 million in 2011, compared to $209 million in 2010, an increase of $211 million in