APS 2011 Annual Report Download - page 113
Download and view the complete annual report
Please find page 113 of the 2011 APS annual report below. You can navigate through the pages in the report by either clicking on the pages listed below, or by using the keyword search tool below to find specific information within the annual report.-
 1
1 -
2
-
3
-
4
-
5
-
6
-
7
-
8
-
9
-
10
-
11
-
12
-
13
-
14
-
15
-
16
-
17
-
18
-
19
-
20
-
21
-
22
-
23
-
24
-
25
-
26
-
27
-
28
-
29
-
30
-
31
-
32
-
33
-
34
-
35
-
36
-
37
-
38
-
39
-
40
-
41
-
42
-
43
-
44
-
45
-
46
-
47
-
48
-
49
-
50
-
51
-
52
-
53
-
54
-
55
-
56
-
57
-
58
-
59
-
60
-
61
-
62
-
63
-
64
-
65
-
66
-
67
-
68
-
69
-
70
-
71
-
72
-
73
-
74
-
75
-
76
-
77
-
78
-
79
-
80
-
81
-
82
-
83
-
84
-
85
-
86
-
87
-
88
-
89
-
90
-
91
-
92
-
93
-
94
-
95
-
96
-
97
-
98
-
99
-
100
-
101
-
102
-
 103
103 -
 104
104 -
 105
105 -
 106
106 -
 107
107 -
 108
108 -
 109
109 -
 110
110 -
 111
111 -
 112
112 -
 113
113 -
 114
114 -
 115
115 -
 116
116 -
 117
117 -
 118
118 -
 119
119 -
 120
120 -
 121
121 -
 122
122 -
 123
123 -
124
-
125
-
126
-
127
-
128
-
129
-
130
-
131
-
132
-
133
-
134
-
135
-
136
-
137
-
138
-
139
-
140
-
141
-
142
-
143
-
144
-
145
-
146
-
147
-
148
-
149
-
150
-
151
-
152
-
153
-
154
-
155
-
156
-
157
-
158
-
159
-
160
-
161
-
162
-
163
-
164
-
165
-
166
-
167
-
168
-
169
-
170
-
171
-
172
-
173
-
174
-
175
-
176
-
177
-
178
-
179
-
180
-
181
-
182
-
183
-
184
-
185
-
186
-
187
-
188
-
189
-
190
-
191
-
192
-
193
-
194
-
195
-
196
-
197
-
198
-
199
-
200
-
201
-
202
-
203
-
204
-
205
-
206
-
207
-
208
-
209
-
210
-
211
-
212
-
213
-
214
-
215
-
216
-
217
-
218
-
219
-
220
-
221
-
222
-
223
-
224
-
225
-
226
-
227
-
228
-
229
-
230
-
231
-
232
-
233
-
234
-
235
-
236
-
237
-
238
-
239
-
240
-
241
-
242
-
243
-
244
-
245
-
246
-
247
-
248
 |
 |

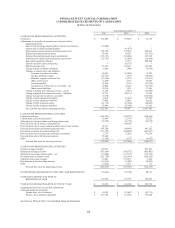
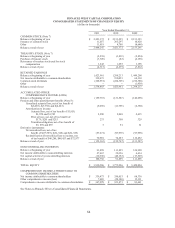
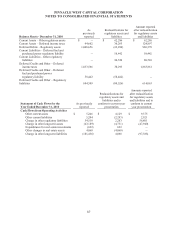
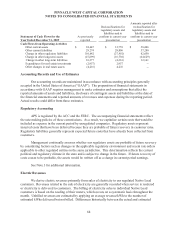
PINNACLE WEST CAPITAL CORPORATION
NOTES TO CONSOLIDATED FINANCIAL STATEMENTS
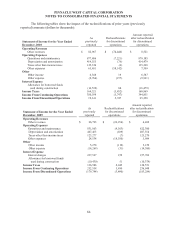
88
Statement of Cash Flows for the
Year Ended December 31, 2009
As previously
reported
Reclassifications for
regulatory assets and
liabilities and to
conform to current year
presentation
Amounts reported after
reclassification for
regulatory assets and
liabilities and to
conform to current year
presentation
Cash Flows from Operating Activities
Other current assets $ 24,647 $ 13,759 $ 38,406
Other current liabilities 29,274 28,006 57,280
Change in other regulatory liabilities 110,642 (27,992) 82,650
Change in other long-term assets (47,899) (16,730) (64,629)
Change in other long-term liabilities 16,377 (4,216) 12,161
Expenditures for real estate investments (2,957) 2,957 --
Other changes in real estate assets (4,216) 4,216 --
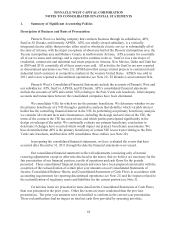
Accounting Records and Use of Estimates
Our accounting records are maintained in accordance with accounting principles generally
accepted in the United States of America (“GAAP”). The preparation of financial statements in
accordance with GAAP requires management to make estimates and assumptions that affect the
reported amounts of assets and liabilities, disclosure of contingent assets and liabilities at the date of
the financial statements and reported amounts of revenues and expenses during the reporting period.
Actual results could differ from those estimates.
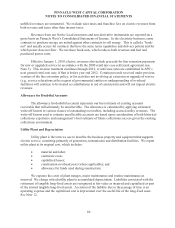
Regulatory Accounting
APS is regulated by the ACC and the FERC. The accompanying financial statements reflect
the rate-making policies of these commissions. As a result, we capitalize certain costs that would be
included as expense in the current period by unregulated companies. Regulatory assets represent
incurred costs that have been deferred because they are probable of future recovery in customer rates.
Regulatory liabilities generally represent expected future costs that have already been collected from
customers.
Management continually assesses whether our regulatory assets are probable of future recovery
by considering factors such as changes in the applicable regulatory environment and recent rate orders
applicable to other regulated entities in the same jurisdiction. This determination reflects the current
political and regulatory climate in the state and is subject to change in the future. If future recovery of
costs ceases to be probable, the assets would be written off as a charge in current period earnings.
See Note 3 for additional information.
Electric Revenues
We derive electric revenues primarily from sales of electricity to our regulated Native Load
customers. Revenues related to the sale of electricity are generally recorded when service is rendered
or electricity is delivered to customers. The billing of electricity sales to individual Native Load
customers is based on the reading of their meters, which occurs on a systematic basis throughout the
month. Unbilled revenues are estimated by applying an average revenue/kWh to the number of
estimated kWhs delivered but not billed. Differences historically between the actual and estimated