APS 2011 Annual Report Download - page 168
Download and view the complete annual report
Please find page 168 of the 2011 APS annual report below. You can navigate through the pages in the report by either clicking on the pages listed below, or by using the keyword search tool below to find specific information within the annual report.-
 1
1 -
2
-
3
-
4
-
5
-
6
-
7
-
8
-
9
-
10
-
11
-
12
-
13
-
14
-
15
-
16
-
17
-
18
-
19
-
20
-
21
-
22
-
23
-
24
-
25
-
26
-
27
-
28
-
29
-
30
-
31
-
32
-
33
-
34
-
35
-
36
-
37
-
38
-
39
-
40
-
41
-
42
-
43
-
44
-
45
-
46
-
47
-
48
-
49
-
50
-
51
-
52
-
53
-
54
-
55
-
56
-
57
-
58
-
59
-
60
-
61
-
62
-
63
-
64
-
65
-
66
-
67
-
68
-
69
-
70
-
71
-
72
-
73
-
74
-
75
-
76
-
77
-
78
-
79
-
80
-
81
-
82
-
83
-
84
-
85
-
86
-
87
-
88
-
89
-
90
-
91
-
92
-
93
-
94
-
95
-
96
-
97
-
98
-
99
-
100
-
101
-
102
-
103
-
104
-
105
-
106
-
107
-
108
-
109
-
110
-
111
-
112
-
113
-
114
-
115
-
116
-
117
-
118
-
119
-
120
-
121
-
122
-
123
-
124
-
125
-
126
-
127
-
128
-
129
-
130
-
131
-
132
-
133
-
134
-
135
-
136
-
137
-
138
-
139
-
140
-
141
-
142
-
143
-
144
-
145
-
146
-
147
-
148
-
149
-
150
-
151
-
152
-
153
-
154
-
155
-
156
-
157
-
 158
158 -
 159
159 -
 160
160 -
 161
161 -
 162
162 -
 163
163 -
 164
164 -
 165
165 -
 166
166 -
 167
167 -
 168
168 -
 169
169 -
 170
170 -
 171
171 -
 172
172 -
 173
173 -
 174
174 -
 175
175 -
 176
176 -
 177
177 -
 178
178 -
179
-
180
-
181
-
182
-
183
-
184
-
185
-
186
-
187
-
188
-
189
-
190
-
191
-
192
-
193
-
194
-
195
-
196
-
197
-
198
-
199
-
200
-
201
-
202
-
203
-
204
-
205
-
206
-
207
-
208
-
209
-
210
-
211
-
212
-
213
-
214
-
215
-
216
-
217
-
218
-
219
-
220
-
221
-
222
-
223
-
224
-
225
-
226
-
227
-
228
-
229
-
230
-
231
-
232
-
233
-
234
-
235
-
236
-
237
-
238
-
239
-
240
-
241
-
242
-
243
-
244
-
245
-
246
-
247
-
248
 |
 |

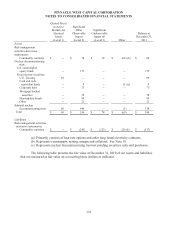
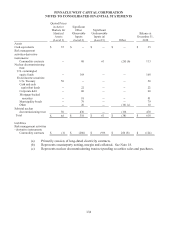
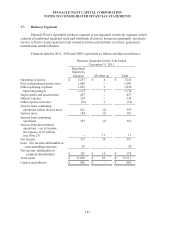
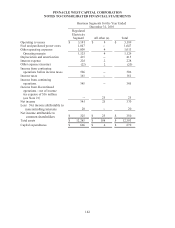
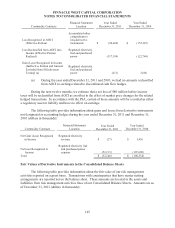
PINNACLE WEST CAPITAL CORPORATION
NOTES TO CONSOLIDATED FINANCIAL STATEMENTS
143
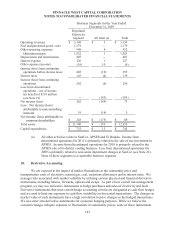
Business Segments for the Year Ended
December 31, 2009
Regulated
Electricity
Segment All other (a)
Total
Operating revenues $ 3,149 $ 5 $ 3,154
Fuel and purchased power costs 1,179 -- 1,179
Other operating expenses 948 4 952
Operating margin 1,022 1 1,023
Depreciation and amortization 407 -- 407
Interest expense 226 1 227
Other expense (income) (16) 10 (6)
Income (loss) from continuing
operations before income taxes 405 (10) 395
Income taxes 143 (4) 139
Income (loss) from continuing
operations 262 (6) 256
Loss from discontinued
operations – net of income
tax benefit of $110 million
(see Note 21) -- (183) (183)
Net income (loss) 262 (189) 73
Less: Net income (loss)
attributable to noncontrolling
interests 19 (14) 5
Net income (loss) attributable to
common shareholders $ 243 $ (175) $ 68
Total assets $ 11,740 $ 295 $ 12,035
Capital expenditures $ 732 $ 13 $ 745
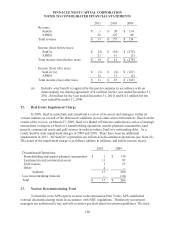
(a) All other activities relate to SunCor, APSES and El Dorado. Income from
discontinued operations for 2011 is primarily related to the sale of our investment in
APSES. Income from discontinued operations for 2010 is primarily related to the
APSES sale of its district cooling business. Loss from discontinued operations for
2009 is primarily related to real estate impairment charges at SunCor (see Note 22).
None of these segments is a reportable business segment.
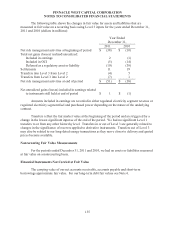
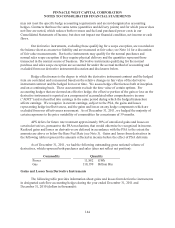
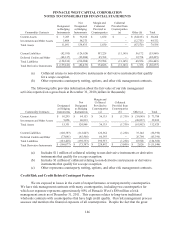
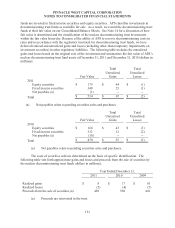
18. Derivative Accounting
We are exposed to the impact of market fluctuations in the commodity price and
transportation costs of electricity, natural gas, coal, emissions allowances and in interest rates. We
manage risks associated with market volatility by utilizing various physical and financial derivative
instruments, including futures, forwards, options and swaps. As part of our overall risk management
program, we may use derivative instruments to hedge purchases and sales of electricity and fuels.
Derivative instruments that meet certain hedge accounting criteria are designated as cash flow hedges
and are used to limit our exposure to cash flow variability on forecasted transactions. The changes in
market value of such instruments have a high correlation to price changes in the hedged transactions.
We also enter into derivative instruments for economic hedging purposes. While we believe the
economic hedges mitigate exposure to fluctuations in commodity prices, some of these instruments