APS 2011 Annual Report Download - page 109
Download and view the complete annual report
Please find page 109 of the 2011 APS annual report below. You can navigate through the pages in the report by either clicking on the pages listed below, or by using the keyword search tool below to find specific information within the annual report.-
 1
1 -
2
-
3
-
4
-
5
-
6
-
7
-
8
-
9
-
10
-
11
-
12
-
13
-
14
-
15
-
16
-
17
-
18
-
19
-
20
-
21
-
22
-
23
-
24
-
25
-
26
-
27
-
28
-
29
-
30
-
31
-
32
-
33
-
34
-
35
-
36
-
37
-
38
-
39
-
40
-
41
-
42
-
43
-
44
-
45
-
46
-
47
-
48
-
49
-
50
-
51
-
52
-
53
-
54
-
55
-
56
-
57
-
58
-
59
-
60
-
61
-
62
-
63
-
64
-
65
-
66
-
67
-
68
-
69
-
70
-
71
-
72
-
73
-
74
-
75
-
76
-
77
-
78
-
79
-
80
-
81
-
82
-
83
-
84
-
85
-
86
-
87
-
88
-
89
-
90
-
91
-
92
-
93
-
94
-
95
-
96
-
97
-
98
-
 99
99 -
 100
100 -
 101
101 -
 102
102 -
 103
103 -
 104
104 -
 105
105 -
 106
106 -
 107
107 -
 108
108 -
 109
109 -
 110
110 -
 111
111 -
 112
112 -
 113
113 -
 114
114 -
 115
115 -
 116
116 -
 117
117 -
 118
118 -
 119
119 -
120
-
121
-
122
-
123
-
124
-
125
-
126
-
127
-
128
-
129
-
130
-
131
-
132
-
133
-
134
-
135
-
136
-
137
-
138
-
139
-
140
-
141
-
142
-
143
-
144
-
145
-
146
-
147
-
148
-
149
-
150
-
151
-
152
-
153
-
154
-
155
-
156
-
157
-
158
-
159
-
160
-
161
-
162
-
163
-
164
-
165
-
166
-
167
-
168
-
169
-
170
-
171
-
172
-
173
-
174
-
175
-
176
-
177
-
178
-
179
-
180
-
181
-
182
-
183
-
184
-
185
-
186
-
187
-
188
-
189
-
190
-
191
-
192
-
193
-
194
-
195
-
196
-
197
-
198
-
199
-
200
-
201
-
202
-
203
-
204
-
205
-
206
-
207
-
208
-
209
-
210
-
211
-
212
-
213
-
214
-
215
-
216
-
217
-
218
-
219
-
220
-
221
-
222
-
223
-
224
-
225
-
226
-
227
-
228
-
229
-
230
-
231
-
232
-
233
-
234
-
235
-
236
-
237
-
238
-
239
-
240
-
241
-
242
-
243
-
244
-
245
-
246
-
247
-
248
 |
 |

84
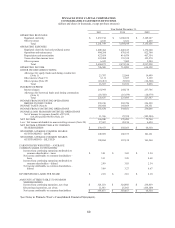
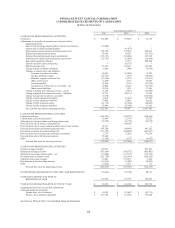
PINNACLE WEST CAPITAL CORPORATION
CONSOLIDATED STATEMENTS OF CHANGES IN EQUITY
(dollars in thousands)
Year Ended December 31,
2011 2010 2009
COMMON STOCK (Note 7)
Balance at beginning of yea
r
$ 2,421,372 $ 2,153,295 $ 2,151,323
Issuance of common stoc
k
11,057 263,297 10,620
Othe
r
11,818 4,780 (8,648)
Balance at end of yea
r
2,444,247 2,421,372 2,153,295
TREASURY STOCK (Note 7)
Balance at beginning of yea
r
(2,239) (3,812) (2,854)
Purchase of treasury stoc
k
(3,720) (82) (2,156)
Reissuance of treasury stock used for stoc
k
compensation 1,242 1,655 1,198
Balance at en
d
of yea
r
(4,717) (2,239) (3,812)
RETAINED EARNINGS
Balance at beginning of yea
r
1,423,961 1,298,213 1,444,208
Net income attributable to common shareholders 339,473 350,053 68,330
Common stock dividends (228,951) (224,305) (212,386)
Othe
r
-- -- (1,939)
Balance at end of yea
r
1,534,483 1,423,961 1,298,213
ACCUMULATED OTHER
COMPREHENSIVE INCOME (LOSS)
Balance at beginning of yea
r
(159,767) (131,587) (146,698)
Pension and other postretirement
b
enefits (Note 8):
Unrealized actuarial loss, net of tax benefit of
$(6,067), $(7,738) and $(4,223) (9,296) (11,795) (6,350)
Amortization to income:
Actuarial loss, net of tax benefit of $1,950,
$1,870 and $1,705 2,990 2,868 2,615
Prior service cost, net of tax benefit of
$179, $201 and $215 275 308 329
Transition obligation, net of tax benefit of
$3, $59 and $39 5 91 61
Derivative instruments:
Net unrealized loss, net of tax
b
enefit of $(37,389), $(61,348) and $(61,329) (57,271) (93,939) (93,996)
Reclassification of net realized loss to income, net
of tax benefit of $46,288, $48,453 and $72,877 70,901 74,287 112,452
Balance at end of yea
r
(152,163) (159,767) (131,587)
NONCONTROLLING INTERESTS
Balance at beginning of yea
r
91,899 111,895 124,990
Net income attributable to noncontrolling interests 27,467 20,156 4,434
Net capital activities by noncontrolling interests (10,630) (40,152) (17,529)
Balance at end of yea
r
108,736 91,899 111,895
TOTAL EQUITY $ 3,930,586 $ 3,775,226 $ 3,428,004
COMPREHENSIVE INCOME ATTRIBUTABLE TO
COMMON SHAREHOLDERS
Net income attributable to common shareholders $ 339,473 $ 350,053 $ 68,330
Other comprehensive income (loss) 7,605 (28,180) 15,111
Comprehensive income attributable to common shareholders $ 347,078 $ 321,873 $ 83,441
See Notes to Pinnacle West’s Consolidated Financial Statements.