APS 2011 Annual Report Download - page 79
Download and view the complete annual report
Please find page 79 of the 2011 APS annual report below. You can navigate through the pages in the report by either clicking on the pages listed below, or by using the keyword search tool below to find specific information within the annual report.-
 1
1 -
2
-
3
-
4
-
5
-
6
-
7
-
8
-
9
-
10
-
11
-
12
-
13
-
14
-
15
-
16
-
17
-
18
-
19
-
20
-
21
-
22
-
23
-
24
-
25
-
26
-
27
-
28
-
29
-
30
-
31
-
32
-
33
-
34
-
35
-
36
-
37
-
38
-
39
-
40
-
41
-
42
-
43
-
44
-
45
-
46
-
47
-
48
-
49
-
50
-
51
-
52
-
53
-
54
-
55
-
56
-
57
-
58
-
59
-
60
-
61
-
62
-
63
-
64
-
65
-
66
-
67
-
68
-
 69
69 -
 70
70 -
 71
71 -
 72
72 -
 73
73 -
 74
74 -
 75
75 -
 76
76 -
 77
77 -
 78
78 -
 79
79 -
 80
80 -
 81
81 -
 82
82 -
 83
83 -
 84
84 -
 85
85 -
 86
86 -
 87
87 -
 88
88 -
 89
89 -
90
-
91
-
92
-
93
-
94
-
95
-
96
-
97
-
98
-
99
-
100
-
101
-
102
-
103
-
104
-
105
-
106
-
107
-
108
-
109
-
110
-
111
-
112
-
113
-
114
-
115
-
116
-
117
-
118
-
119
-
120
-
121
-
122
-
123
-
124
-
125
-
126
-
127
-
128
-
129
-
130
-
131
-
132
-
133
-
134
-
135
-
136
-
137
-
138
-
139
-
140
-
141
-
142
-
143
-
144
-
145
-
146
-
147
-
148
-
149
-
150
-
151
-
152
-
153
-
154
-
155
-
156
-
157
-
158
-
159
-
160
-
161
-
162
-
163
-
164
-
165
-
166
-
167
-
168
-
169
-
170
-
171
-
172
-
173
-
174
-
175
-
176
-
177
-
178
-
179
-
180
-
181
-
182
-
183
-
184
-
185
-
186
-
187
-
188
-
189
-
190
-
191
-
192
-
193
-
194
-
195
-
196
-
197
-
198
-
199
-
200
-
201
-
202
-
203
-
204
-
205
-
206
-
207
-
208
-
209
-
210
-
211
-
212
-
213
-
214
-
215
-
216
-
217
-
218
-
219
-
220
-
221
-
222
-
223
-
224
-
225
-
226
-
227
-
228
-
229
-
230
-
231
-
232
-
233
-
234
-
235
-
236
-
237
-
238
-
239
-
240
-
241
-
242
-
243
-
244
-
245
-
246
-
247
-
248
 |
 |

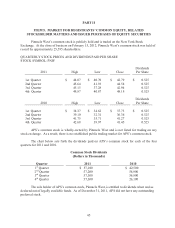
55
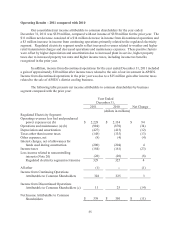
Operating Results – 2011 compared with 2010
Our consolidated net income attributable to common shareholders for the year ended
December 31, 2011 was $339 million, compared with net income of $350 million for the prior year. The
$11 million net decrease consisted of a $14 million decrease in income from discontinued operations and
a $3 million increase in income from continuing operations primarily related to the regulated electricity
segment. Regulated electricity segment results reflect increased revenues related to weather and higher
retail transmission charges and decreased operations and maintenance expenses. These positive factors
were offset by higher depreciation and amortization due to increased plant in service, higher property
taxes due to increased property tax rates and higher income taxes, including income tax benefits
recognized in the prior year.
In addition, income from discontinued operations for the year ended December 31, 2011 included
a gain of approximately $10 million after income taxes related to the sale of our investment in APSES.
Income from discontinued operations in the prior year was due to a $25 million gain after income taxes
related to the sale of APSES’s district cooling business.
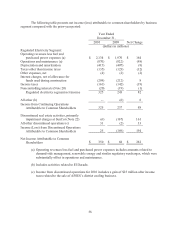
The following table presents net income attributable to common shareholders by business
segment compared with the prior year:
Year Ended
December 31,
Net Change
2011 2010
(dollars in millions)
Regulated Electricity Segment:
Operating revenues less fuel and purchased
power expenses (a) (b) $ 2,228 $ 2,134 $ 94
Operations and maintenance (a) (b) (904) (870) (34)
Depreciation and amortization (427) (415) (12)
Taxes other than income taxes (148) (135) (13)
Other expenses, net (8) (4) (4)
Interest charges, net of allowances for
funds used during construction (200) (204) 4
Income taxes (184) (161) (23)
Less income related to noncontrolling
interests (Note 20) (28) (20) (8)
Regulated electricity segment net income 329 325 4
All other (1) -- (1)
Income from Continuing Operations
Attributable to Common Shareholders
328
325
3
Income from Discontinued Operations
Attributable to Common Shareholders (c) 11 25 (14)
Net Income Attributable to Common
Shareholders $ 339 $ 350 $ (11)