APS 2011 Annual Report Download - page 63
Download and view the complete annual report
Please find page 63 of the 2011 APS annual report below. You can navigate through the pages in the report by either clicking on the pages listed below, or by using the keyword search tool below to find specific information within the annual report.-
 1
1 -
2
-
3
-
4
-
5
-
6
-
7
-
8
-
9
-
10
-
11
-
12
-
13
-
14
-
15
-
16
-
17
-
18
-
19
-
20
-
21
-
22
-
23
-
24
-
25
-
26
-
27
-
28
-
29
-
30
-
31
-
32
-
33
-
34
-
35
-
36
-
37
-
38
-
39
-
40
-
41
-
42
-
43
-
44
-
45
-
46
-
47
-
48
-
49
-
50
-
51
-
52
-
 53
53 -
 54
54 -
 55
55 -
 56
56 -
 57
57 -
 58
58 -
 59
59 -
 60
60 -
 61
61 -
 62
62 -
 63
63 -
 64
64 -
 65
65 -
 66
66 -
 67
67 -
 68
68 -
 69
69 -
 70
70 -
 71
71 -
 72
72 -
 73
73 -
74
-
75
-
76
-
77
-
78
-
79
-
80
-
81
-
82
-
83
-
84
-
85
-
86
-
87
-
88
-
89
-
90
-
91
-
92
-
93
-
94
-
95
-
96
-
97
-
98
-
99
-
100
-
101
-
102
-
103
-
104
-
105
-
106
-
107
-
108
-
109
-
110
-
111
-
112
-
113
-
114
-
115
-
116
-
117
-
118
-
119
-
120
-
121
-
122
-
123
-
124
-
125
-
126
-
127
-
128
-
129
-
130
-
131
-
132
-
133
-
134
-
135
-
136
-
137
-
138
-
139
-
140
-
141
-
142
-
143
-
144
-
145
-
146
-
147
-
148
-
149
-
150
-
151
-
152
-
153
-
154
-
155
-
156
-
157
-
158
-
159
-
160
-
161
-
162
-
163
-
164
-
165
-
166
-
167
-
168
-
169
-
170
-
171
-
172
-
173
-
174
-
175
-
176
-
177
-
178
-
179
-
180
-
181
-
182
-
183
-
184
-
185
-
186
-
187
-
188
-
189
-
190
-
191
-
192
-
193
-
194
-
195
-
196
-
197
-
198
-
199
-
200
-
201
-
202
-
203
-
204
-
205
-
206
-
207
-
208
-
209
-
210
-
211
-
212
-
213
-
214
-
215
-
216
-
217
-
218
-
219
-
220
-
221
-
222
-
223
-
224
-
225
-
226
-
227
-
228
-
229
-
230
-
231
-
232
-
233
-
234
-
235
-
236
-
237
-
238
-
239
-
240
-
241
-
242
-
243
-
244
-
245
-
246
-
247
-
248
 |
 |

39
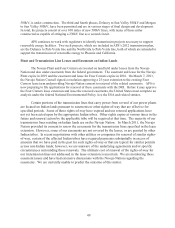
Southern California Public Power Authority (5.91%), and Los Angeles Department of
Water & Power (5.7%). The plant is operated by APS.
(c) The other participants are Salt River Project (10%), Public Service Company of New
Mexico (13%), SCE (48%), Tucson Electric Power Company (7%) and El Paso Electric
Company (7%). The plant is operated by APS. As discussed under “Business of Arizona
Public Service Company – Energy Sources and Resource Planning – Generation Facilities
– Coal Fueled Generating Facilities – Four Corners” in Item 1, APS and SCE have entered
into an agreement by which APS would acquire SCE’s interest in Units 4 and 5, after
which APS would close Units 1, 2 and 3.
(d) The other participants are Salt River Project (21.7%), Nevada Power Company (11.3%),
the United States Government (24.3%), Tucson Electric Power Company (7.5%) and Los
Angeles Department of Water & Power (21.2%). The plant is operated by Salt River
Project.
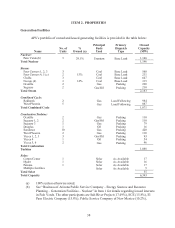
See “Business of Arizona Public Service Company – Environmental Matters” in Item 1 with
respect to matters having a possible impact on the operation of certain of APS’s generating facilities.
See “Business of Arizona Public Service Company” in Item 1 for a map detailing the location
of APS’s major power plants and principal transmission lines.
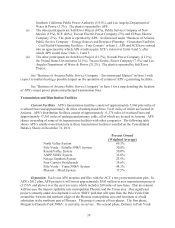
Transmission and Distribution Facilities
Current Facilities. APS’s transmission facilities consist of approximately 5,866 pole miles of
overhead lines and approximately 49 miles of underground lines, 5,643 miles of which are located in
Arizona. APS’s distribution facilities consist of approximately 11,376 miles of overhead lines and
approximately 17,561 miles of underground primary cable, all of which are located in Arizona. APS
shares ownership of some of its transmission facilities with other companies. The following table
shows APS’s jointly-owned interests in those transmission facilities recorded on the Consolidated
Balance Sheets at December 31, 2011:
Percent Owned
(Weighted Average)
North Valley System 69.3%
Palo Verde – Estrella 500kV System 50.0%
Round Valley System 50.0%
ANPP 500kV System 33.0%
Navajo Southern System 25.9%
Four Corners Switchyards 39.6%
Palo Verde – Yuma 500kV System 44.1%
Phoenix – Mead System 17.5%
Expansion. Each year APS prepares and files with the ACC a ten-year transmission plan. In
APS’s 2012 plan, APS projects it will invest approximately $550 million in new transmission projects
(115 kV and above) over the next ten years, which includes 269 miles of new lines. This investment
will increase the import capability into metropolitan Phoenix and the Yuma area. One significant
project currently under development is a new 500kV path that will span from the Palo Verde Hub
around the western and northern edges of the Phoenix metropolitan area and terminate at a bulk
substation in the northeast part of Phoenix. The project consists of four phases. The first phase,
Morgan to Pinnacle Peak 500kV, is currently in-service. The second phase, Delaney to Palo Verde