APS 2011 Annual Report Download - page 170
Download and view the complete annual report
Please find page 170 of the 2011 APS annual report below. You can navigate through the pages in the report by either clicking on the pages listed below, or by using the keyword search tool below to find specific information within the annual report.-
 1
1 -
2
-
3
-
4
-
5
-
6
-
7
-
8
-
9
-
10
-
11
-
12
-
13
-
14
-
15
-
16
-
17
-
18
-
19
-
20
-
21
-
22
-
23
-
24
-
25
-
26
-
27
-
28
-
29
-
30
-
31
-
32
-
33
-
34
-
35
-
36
-
37
-
38
-
39
-
40
-
41
-
42
-
43
-
44
-
45
-
46
-
47
-
48
-
49
-
50
-
51
-
52
-
53
-
54
-
55
-
56
-
57
-
58
-
59
-
60
-
61
-
62
-
63
-
64
-
65
-
66
-
67
-
68
-
69
-
70
-
71
-
72
-
73
-
74
-
75
-
76
-
77
-
78
-
79
-
80
-
81
-
82
-
83
-
84
-
85
-
86
-
87
-
88
-
89
-
90
-
91
-
92
-
93
-
94
-
95
-
96
-
97
-
98
-
99
-
100
-
101
-
102
-
103
-
104
-
105
-
106
-
107
-
108
-
109
-
110
-
111
-
112
-
113
-
114
-
115
-
116
-
117
-
118
-
119
-
120
-
121
-
122
-
123
-
124
-
125
-
126
-
127
-
128
-
129
-
130
-
131
-
132
-
133
-
134
-
135
-
136
-
137
-
138
-
139
-
140
-
141
-
142
-
143
-
144
-
145
-
146
-
147
-
148
-
149
-
150
-
151
-
152
-
153
-
154
-
155
-
156
-
157
-
158
-
159
-
 160
160 -
 161
161 -
 162
162 -
 163
163 -
 164
164 -
 165
165 -
 166
166 -
 167
167 -
 168
168 -
 169
169 -
 170
170 -
 171
171 -
 172
172 -
 173
173 -
 174
174 -
 175
175 -
 176
176 -
 177
177 -
 178
178 -
 179
179 -
 180
180 -
181
-
182
-
183
-
184
-
185
-
186
-
187
-
188
-
189
-
190
-
191
-
192
-
193
-
194
-
195
-
196
-
197
-
198
-
199
-
200
-
201
-
202
-
203
-
204
-
205
-
206
-
207
-
208
-
209
-
210
-
211
-
212
-
213
-
214
-
215
-
216
-
217
-
218
-
219
-
220
-
221
-
222
-
223
-
224
-
225
-
226
-
227
-
228
-
229
-
230
-
231
-
232
-
233
-
234
-
235
-
236
-
237
-
238
-
239
-
240
-
241
-
242
-
243
-
244
-
245
-
246
-
247
-
248
 |
 |

PINNACLE WEST CAPITAL CORPORATION
NOTES TO CONSOLIDATED FINANCIAL STATEMENTS
145
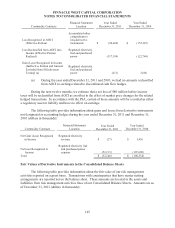
Commodity Contracts
Financial Statement
Location
Year Ended
December 31, 2011
Year Ended
December 31, 2010
Loss Recognized in AOCI
(Effective Portion)
Accumulated other
comprehensive
loss-derivative
instruments $ (94,660) $ (155,287)
Loss Reclassified from AOCI into
Income (Effective Portion
Realized)
Regulated electricity
fuel and purchased
power (117,189) (122,740)
Gain (Loss) Recognized in Income
(Ineffective Portion and Amount
Excluded from Effectiveness
Testing) (a)
Regulated electricity
fuel and purchased
power (211) 3,680
(a) During the year ended December 31, 2011 and 2010, we had no amounts reclassified
from AOCI to earnings related to discontinued cash flow hedges.
During the next twelve months, we estimate that a net loss of $80 million before income
taxes will be reclassified from AOCI as an offset to the effect of market price changes for the related
hedged transactions. In accordance with the PSA, certain of these amounts will be recorded as either
a regulatory asset or liability and have no effect on earnings.
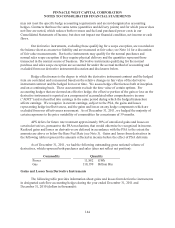
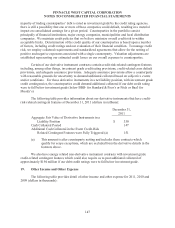
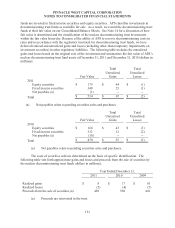
The following table provides information about gains and losses from derivative instruments
not designated as accounting hedges during the year ended December 31, 2011 and December 31,
2010 (dollars in thousands):
Commodity Contracts
Financial Statement
Location
Year Ended
December 31, 2011
Year Ended
December 31, 2010
Net Gain (Loss) Recognized
in Income
Regulated electricity
revenue $ (27) $ 1,436
Net Loss Recognized in
Income
Regulated electricity fuel
and purchased power
expense (52,113) (107,690)
Total $ (52,140) $ (106,254)
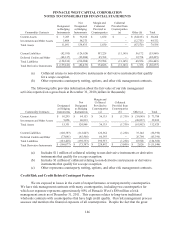
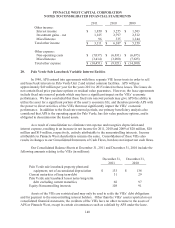
Fair Values of Derivative Instruments in the Consolidated Balance Sheets
The following table provides information about the fair value of our risk management
activities reported on a gross basis. Transactions with counterparties that have master netting
arrangements are reported net on the balance sheet. These amounts are located in the assets and
liabilities from risk management activities lines of our Consolidated Balance Sheets. Amounts are as
of December 31, 2011 (dollars in thousands):