APS 2011 Annual Report Download - page 78
Download and view the complete annual report
Please find page 78 of the 2011 APS annual report below. You can navigate through the pages in the report by either clicking on the pages listed below, or by using the keyword search tool below to find specific information within the annual report.-
 1
1 -
2
-
3
-
4
-
5
-
6
-
7
-
8
-
9
-
10
-
11
-
12
-
13
-
14
-
15
-
16
-
17
-
18
-
19
-
20
-
21
-
22
-
23
-
24
-
25
-
26
-
27
-
28
-
29
-
30
-
31
-
32
-
33
-
34
-
35
-
36
-
37
-
38
-
39
-
40
-
41
-
42
-
43
-
44
-
45
-
46
-
47
-
48
-
49
-
50
-
51
-
52
-
53
-
54
-
55
-
56
-
57
-
58
-
59
-
60
-
61
-
62
-
63
-
64
-
65
-
66
-
67
-
 68
68 -
 69
69 -
 70
70 -
 71
71 -
 72
72 -
 73
73 -
 74
74 -
 75
75 -
 76
76 -
 77
77 -
 78
78 -
 79
79 -
 80
80 -
 81
81 -
 82
82 -
 83
83 -
 84
84 -
 85
85 -
 86
86 -
 87
87 -
 88
88 -
89
-
90
-
91
-
92
-
93
-
94
-
95
-
96
-
97
-
98
-
99
-
100
-
101
-
102
-
103
-
104
-
105
-
106
-
107
-
108
-
109
-
110
-
111
-
112
-
113
-
114
-
115
-
116
-
117
-
118
-
119
-
120
-
121
-
122
-
123
-
124
-
125
-
126
-
127
-
128
-
129
-
130
-
131
-
132
-
133
-
134
-
135
-
136
-
137
-
138
-
139
-
140
-
141
-
142
-
143
-
144
-
145
-
146
-
147
-
148
-
149
-
150
-
151
-
152
-
153
-
154
-
155
-
156
-
157
-
158
-
159
-
160
-
161
-
162
-
163
-
164
-
165
-
166
-
167
-
168
-
169
-
170
-
171
-
172
-
173
-
174
-
175
-
176
-
177
-
178
-
179
-
180
-
181
-
182
-
183
-
184
-
185
-
186
-
187
-
188
-
189
-
190
-
191
-
192
-
193
-
194
-
195
-
196
-
197
-
198
-
199
-
200
-
201
-
202
-
203
-
204
-
205
-
206
-
207
-
208
-
209
-
210
-
211
-
212
-
213
-
214
-
215
-
216
-
217
-
218
-
219
-
220
-
221
-
222
-
223
-
224
-
225
-
226
-
227
-
228
-
229
-
230
-
231
-
232
-
233
-
234
-
235
-
236
-
237
-
238
-
239
-
240
-
241
-
242
-
243
-
244
-
245
-
246
-
247
-
248
 |
 |
54
purchased power and generation fuel, our power plant performance, transmission availability or
constraints, prevailing market prices, new generating plants being placed in service in our market areas,
our hedging program for managing such costs and PSA deferrals and the related amortization.
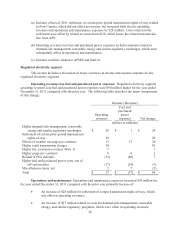
Operations and Maintenance Expenses. Operations and maintenance expenses are impacted by
growth, power plant operations, maintenance of utility plant (including generation, transmission, and
distribution facilities), inflation, outages, higher-trending pension and other postretirement benefit costs,
renewable energy and demand side management related expenses (which are offset by the same amount
of regulated electricity segment operating revenues) and other factors. In the settlement agreement
related to the 2008 retail rate case, APS committed to operational expense reductions from 2010 through
2014 and received approval to defer certain pension and other postretirement benefit cost increases to be
incurred in 2011 and 2012.
Depreciation and Amortization Expenses. Depreciation and amortization expenses are impacted
by net additions to utility plant and other property (such as new generation, transmission, and distribution
facilities), and changes in depreciation and amortization rates. See “Capital Expenditures” below for
information regarding the planned additions to our facilities. With the twenty-year extensions of the
operating licenses for each of the Palo Verde units recently granted by the NRC, we estimate that our
pretax depreciation expense will decrease by approximately $34 million per year starting on January 1,
2012.
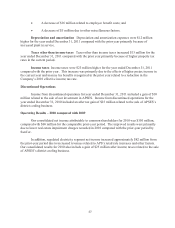
Property Taxes. Taxes other than income taxes consist primarily of property taxes, which are
affected by the value of property in-service and under construction, assessment ratios, and tax rates. The
average property tax rate in Arizona for APS, which owns essentially all of our property, was 9.0% of the
assessed value for 2011, 8.0% for 2010 and 7.5% for 2009. We expect property taxes to increase as we
add new generating units and continue with improvements and expansions to our existing generating
units, transmission and distribution facilities. (See Note 3 for property tax deferrals proposed in the
Settlement Agreement.)
Income Taxes. Income taxes are affected by the amount of pre-tax book income, income tax
rates, and certain non-taxable items, such as the AFUDC. In addition, income taxes may also be affected
by the settlement of issues with taxing authorities.
Interest Expense. Interest expense is affected by the amount of debt outstanding and the interest
rates on that debt (see Note 6.) The primary factors affecting borrowing levels are expected to be our
capital expenditures, long-term debt maturities, equity issuances and internally generated cash flow. An
allowance for borrowed funds offsets a portion of interest expense while capital projects are under
construction. We stop accruing AFUDC on a project when it is placed in commercial operation.
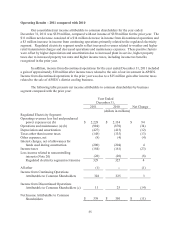
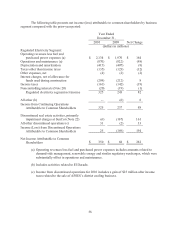
RESULTS OF OPERATIONS
Pinnacle West’s reportable business segment is our regulated electricity segment, which consists
of traditional regulated retail and wholesale electricity businesses (primarily electricity service to Native
Load customers) and related activities and includes electricity generation, transmission and distribution.
APSES’s and SunCor’s operations have been classified as discontinued operations. Pinnacle
West sold its investment in APSES in August 2011.