APS 2011 Annual Report Download - page 93
Download and view the complete annual report
Please find page 93 of the 2011 APS annual report below. You can navigate through the pages in the report by either clicking on the pages listed below, or by using the keyword search tool below to find specific information within the annual report.-
 1
1 -
2
-
3
-
4
-
5
-
6
-
7
-
8
-
9
-
10
-
11
-
12
-
13
-
14
-
15
-
16
-
17
-
18
-
19
-
20
-
21
-
22
-
23
-
24
-
25
-
26
-
27
-
28
-
29
-
30
-
31
-
32
-
33
-
34
-
35
-
36
-
37
-
38
-
39
-
40
-
41
-
42
-
43
-
44
-
45
-
46
-
47
-
48
-
49
-
50
-
51
-
52
-
53
-
54
-
55
-
56
-
57
-
58
-
59
-
60
-
61
-
62
-
63
-
64
-
65
-
66
-
67
-
68
-
69
-
70
-
71
-
72
-
73
-
74
-
75
-
76
-
77
-
78
-
79
-
80
-
81
-
82
-
 83
83 -
 84
84 -
 85
85 -
 86
86 -
 87
87 -
 88
88 -
 89
89 -
 90
90 -
 91
91 -
 92
92 -
 93
93 -
 94
94 -
 95
95 -
 96
96 -
 97
97 -
 98
98 -
 99
99 -
 100
100 -
 101
101 -
 102
102 -
 103
103 -
104
-
105
-
106
-
107
-
108
-
109
-
110
-
111
-
112
-
113
-
114
-
115
-
116
-
117
-
118
-
119
-
120
-
121
-
122
-
123
-
124
-
125
-
126
-
127
-
128
-
129
-
130
-
131
-
132
-
133
-
134
-
135
-
136
-
137
-
138
-
139
-
140
-
141
-
142
-
143
-
144
-
145
-
146
-
147
-
148
-
149
-
150
-
151
-
152
-
153
-
154
-
155
-
156
-
157
-
158
-
159
-
160
-
161
-
162
-
163
-
164
-
165
-
166
-
167
-
168
-
169
-
170
-
171
-
172
-
173
-
174
-
175
-
176
-
177
-
178
-
179
-
180
-
181
-
182
-
183
-
184
-
185
-
186
-
187
-
188
-
189
-
190
-
191
-
192
-
193
-
194
-
195
-
196
-
197
-
198
-
199
-
200
-
201
-
202
-
203
-
204
-
205
-
206
-
207
-
208
-
209
-
210
-
211
-
212
-
213
-
214
-
215
-
216
-
217
-
218
-
219
-
220
-
221
-
222
-
223
-
224
-
225
-
226
-
227
-
228
-
229
-
230
-
231
-
232
-
233
-
234
-
235
-
236
-
237
-
238
-
239
-
240
-
241
-
242
-
243
-
244
-
245
-
246
-
247
-
248
 |
 |

69
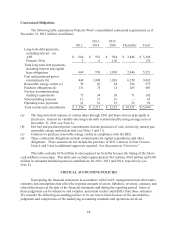
Regulatory Accounting
Regulatory accounting allows for the actions of regulators, such as the ACC and the FERC, to
be reflected in our financial statements. Their actions may cause us to capitalize costs that would
otherwise be included as an expense in the current period by unregulated companies. Regulatory assets
represent incurred costs that have been deferred because they are probable of future recovery in
customer rates. Regulatory liabilities generally represent expected future costs that have already been
collected from customers. Management continually assesses whether our regulatory assets are
probable of future recovery by considering factors such as applicable regulatory environment changes
and recent rate orders to other regulated entities in the same jurisdiction. This determination reflects
the current political and regulatory climate in the state and is subject to change in the future. If future
recovery of costs ceases to be probable, the assets would be written off as a charge in current period
earnings. We had $1.4 billion of regulatory assets and $826 million of regulatory liabilities on the
Consolidated Balance Sheets at December 31, 2011.
Included in the balance of regulatory assets at December 31, 2011 is a regulatory asset of $1.0
billion for pension and other postretirement benefits. This regulatory asset represents the future
recovery of these costs through retail rates as these amounts are charged to earnings. If these costs are
disallowed by the ACC, this regulatory asset would be charged to OCI and result in lower future
earnings.
See Notes 1 and 3 for more information.
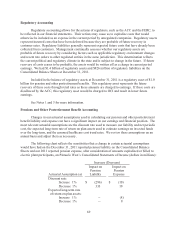
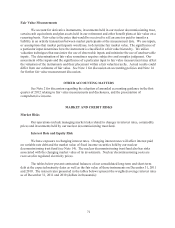
Pensions and Other Postretirement Benefit Accounting
Changes in our actuarial assumptions used in calculating our pension and other postretirement
benefit liability and expense can have a significant impact on our earnings and financial position. The
most relevant actuarial assumptions are the discount rate used to measure our liability and net periodic
cost, the expected long-term rate of return on plan assets used to estimate earnings on invested funds
over the long-term, and the assumed healthcare cost trend rates. We review these assumptions on an
annual basis and adjust them as necessary.
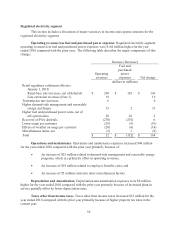
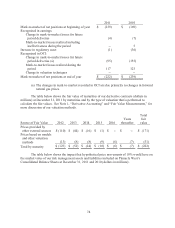
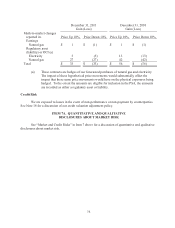
The following chart reflects the sensitivities that a change in certain actuarial assumptions
would have had on the December 31, 2011 reported pension liability on the Consolidated Balance
Sheets and our 2011 reported pension expense, after consideration of amounts capitalized or billed to
electric plant participants, on Pinnacle West’s Consolidated Statements of Income (dollars in millions):
Increase (Decrease)
Actuarial Assumption (a)
Impact on
Pension
Liability
Impact on
Pension
Expense
Discount rate:
Increase 1% $ (296) $ (10)
Decrease 1% 333 10
Expected long-term rate
of return on plan assets:
Increase 1% -- (8)
Decrease 1% -- 8