APS 2011 Annual Report Download - page 34
Download and view the complete annual report
Please find page 34 of the 2011 APS annual report below. You can navigate through the pages in the report by either clicking on the pages listed below, or by using the keyword search tool below to find specific information within the annual report.-
 1
1 -
 2
2 -
 3
3 -
 4
4 -
 5
5 -
 6
6 -
 7
7 -
 8
8 -
 9
9 -
 10
10 -
 11
11 -
 12
12 -
 13
13 -
 14
14 -
 15
15 -
 16
16 -
 17
17 -
 18
18 -
 19
19 -
 20
20 -
 21
21 -
 22
22 -
 23
23 -
 24
24 -
 25
25 -
 26
26 -
 27
27 -
 28
28 -
 29
29 -
 30
30 -
 31
31 -
 32
32 -
 33
33 -
 34
34 -
 35
35 -
 36
36 -
 37
37 -
 38
38 -
 39
39 -
 40
40 -
 41
41 -
 42
42 -
 43
43 -
 44
44 -
 45
45 -
 46
46 -
 47
47 -
 48
48 -
 49
49 -
 50
50 -
 51
51 -
 52
52 -
 53
53 -
 54
54 -
 55
55 -
 56
56 -
 57
57 -
 58
58 -
 59
59 -
 60
60 -
 61
61 -
 62
62 -
 63
63 -
 64
64 -
 65
65 -
 66
66 -
 67
67 -
 68
68 -
 69
69 -
 70
70 -
 71
71 -
 72
72 -
 73
73 -
 74
74 -
 75
75 -
 76
76 -
 77
77 -
 78
78 -
 79
79 -
 80
80 -
 81
81 -
 82
82 -
 83
83 -
 84
84 -
 85
85 -
 86
86 -
 87
87 -
 88
88 -
 89
89 -
 90
90 -
 91
91 -
 92
92 -
 93
93 -
 94
94 -
 95
95 -
 96
96 -
 97
97 -
 98
98 -
 99
99 -
 100
100 -
 101
101 -
 102
102 -
 103
103 -
 104
104 -
 105
105 -
 106
106 -
 107
107 -
 108
108 -
 109
109 -
 110
110 -
 111
111 -
 112
112 -
 113
113 -
 114
114 -
 115
115 -
 116
116 -
 117
117 -
 118
118 -
 119
119 -
 120
120 -
 121
121 -
 122
122 -
 123
123 -
 124
124 -
 125
125 -
 126
126 -
 127
127 -
 128
128 -
 129
129 -
 130
130 -
 131
131 -
 132
132 -
 133
133 -
 134
134 -
 135
135 -
 136
136 -
 137
137 -
 138
138 -
 139
139 -
 140
140 -
 141
141 -
 142
142 -
 143
143 -
 144
144 -
 145
145 -
 146
146 -
 147
147 -
 148
148 -
 149
149 -
 150
150 -
 151
151 -
 152
152 -
 153
153 -
 154
154 -
 155
155 -
 156
156 -
 157
157 -
 158
158 -
 159
159 -
 160
160 -
 161
161 -
 162
162 -
 163
163 -
 164
164 -
 165
165 -
 166
166 -
 167
167 -
 168
168 -
 169
169 -
 170
170 -
 171
171 -
 172
172 -
 173
173 -
 174
174 -
 175
175 -
 176
176 -
 177
177 -
 178
178 -
 179
179 -
 180
180 -
 181
181 -
 182
182 -
 183
183 -
 184
184 -
 185
185 -
 186
186 -
 187
187 -
 188
188 -
 189
189 -
 190
190 -
 191
191 -
 192
192 -
 193
193 -
 194
194 -
 195
195 -
 196
196 -
 197
197 -
 198
198 -
 199
199 -
 200
200 -
 201
201 -
 202
202 -
 203
203 -
 204
204 -
 205
205 -
 206
206 -
 207
207 -
 208
208 -
 209
209 -
 210
210 -
 211
211 -
 212
212 -
 213
213 -
 214
214 -
 215
215 -
 216
216 -
 217
217 -
 218
218 -
 219
219 -
 220
220 -
 221
221 -
 222
222 -
 223
223 -
 224
224 -
 225
225 -
 226
226 -
 227
227 -
 228
228 -
 229
229 -
 230
230 -
 231
231 -
 232
232 -
 233
233 -
 234
234 -
 235
235 -
 236
236 -
 237
237 -
 238
238 -
 239
239 -
 240
240 -
 241
241 -
 242
242 -
 243
243 -
 244
244 -
 245
245 -
 246
246 -
 247
247 -
 248
248
 |
 |

10
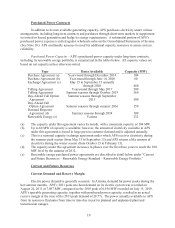
Purchased Power Contracts
In addition to its own available generating capacity, APS purchases electricity under various
arrangements, including long-term contracts and purchases through short-term markets to supplement
its owned or leased generation and hedge its energy requirements. A substantial portion of APS’s
purchased power expense is netted against wholesale sales on the Consolidated Statements of Income.
(See Note 18.) APS continually assesses its need for additional capacity resources to assure system
reliability.
Purchased Power Capacity – APS’s purchased power capacity under long-term contracts,
including its renewable energy portfolio, is summarized in the tables below. All capacity values are
based on net capacity unless otherwise noted.
T
yp
e Dates Available Ca
p
acit
y
(MW)
Purchase A
g
reement
(
a
)
Yea
r
-round throu
g
h December 2014 104
Purchase A
g
reement
(
b
)
Yea
r
-round throu
g
h June 14, 2020 60
Exchange Agreement (c) May 15 to September 15 annually
throu
g
h 2020 480
Tollin
g
A
g
reement Yea
r
-round throu
g
h Ma
y
2017 500
Tollin
g
A
g
reement Summer seasons throu
g
h October 2019 560
Day-Ahead Call Option
A
g
reemen
t
Summer seasons through September
2015 500
Day-Ahead Call
O
p
tion A
g
reement Summer seasons throu
g
h summer 2016 150
Demand Response
A
g
reemen
t
(
d
)
Summer seasons throu
g
h 2024 100
Renewable Ener
gy
(
e
)
Various 232
(a) The capacity under this agreement varies by month, with a maximum capacity of 104 MW.
(b) Up to 60 MW of capacity is available; however, the amount of electricity available to APS
under this agreement is based in large part on customer demand and is adjusted annually.
(c) This is a seasonal capacity exchange agreement under which APS receives electricity during
the summer peak season (from May 15 to September 15) and APS returns a like amount of
electricity during the winter season (from October 15 to February 15).
(d) The capacity under this agreement increases in phases over the first three years to reach the 100
MW level by the summer of 2012.
(e) Renewable energy purchased power agreements are described in detail below under “Current
and Future Resources – Renewable Energy Standard – Renewable Energy Portfolio.”
Current and Future Resources
Current Demand and Reserve Margin
Electric power demand is generally seasonal. In Arizona, demand for power peaks during the
hot summer months. APS’s 2011 peak one-hour demand on its electric system was recorded on
August 24, 2011 at 7,087 MW, compared to the 2010 peak of 6,936 MW recorded on July 15, 2010.
APS’s operable generating capacity, together with purchased power capacity, resulted in an actual
reserve margin at the time of the 2011 peak demand of 28.7%. The power actually available to APS
from its resources fluctuates from time to time due in part to planned and unplanned plant and
transmission outages.
