APS 2011 Annual Report Download - page 62
Download and view the complete annual report
Please find page 62 of the 2011 APS annual report below. You can navigate through the pages in the report by either clicking on the pages listed below, or by using the keyword search tool below to find specific information within the annual report.-
 1
1 -
2
-
3
-
4
-
5
-
6
-
7
-
8
-
9
-
10
-
11
-
12
-
13
-
14
-
15
-
16
-
17
-
18
-
19
-
20
-
21
-
22
-
23
-
24
-
25
-
26
-
27
-
28
-
29
-
30
-
31
-
32
-
33
-
34
-
35
-
36
-
37
-
38
-
39
-
40
-
41
-
42
-
43
-
44
-
45
-
46
-
47
-
48
-
49
-
50
-
51
-
 52
52 -
 53
53 -
 54
54 -
 55
55 -
 56
56 -
 57
57 -
 58
58 -
 59
59 -
 60
60 -
 61
61 -
 62
62 -
 63
63 -
 64
64 -
 65
65 -
 66
66 -
 67
67 -
 68
68 -
 69
69 -
 70
70 -
 71
71 -
 72
72 -
73
-
74
-
75
-
76
-
77
-
78
-
79
-
80
-
81
-
82
-
83
-
84
-
85
-
86
-
87
-
88
-
89
-
90
-
91
-
92
-
93
-
94
-
95
-
96
-
97
-
98
-
99
-
100
-
101
-
102
-
103
-
104
-
105
-
106
-
107
-
108
-
109
-
110
-
111
-
112
-
113
-
114
-
115
-
116
-
117
-
118
-
119
-
120
-
121
-
122
-
123
-
124
-
125
-
126
-
127
-
128
-
129
-
130
-
131
-
132
-
133
-
134
-
135
-
136
-
137
-
138
-
139
-
140
-
141
-
142
-
143
-
144
-
145
-
146
-
147
-
148
-
149
-
150
-
151
-
152
-
153
-
154
-
155
-
156
-
157
-
158
-
159
-
160
-
161
-
162
-
163
-
164
-
165
-
166
-
167
-
168
-
169
-
170
-
171
-
172
-
173
-
174
-
175
-
176
-
177
-
178
-
179
-
180
-
181
-
182
-
183
-
184
-
185
-
186
-
187
-
188
-
189
-
190
-
191
-
192
-
193
-
194
-
195
-
196
-
197
-
198
-
199
-
200
-
201
-
202
-
203
-
204
-
205
-
206
-
207
-
208
-
209
-
210
-
211
-
212
-
213
-
214
-
215
-
216
-
217
-
218
-
219
-
220
-
221
-
222
-
223
-
224
-
225
-
226
-
227
-
228
-
229
-
230
-
231
-
232
-
233
-
234
-
235
-
236
-
237
-
238
-
239
-
240
-
241
-
242
-
243
-
244
-
245
-
246
-
247
-
248
 |
 |

38
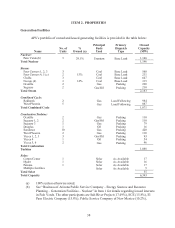
ITEM 2. PROPERTIES
Generation Facilities
APS’s portfolio of owned and leased generating facilities is provided in the table below:
Name
No. of
Units
%
Owned (a)
Principal
Fuels
Used
Primary
Dispatch
Type
Owned
Capacity
(MW)
Nuclear:
Palo Verde (b) 3 29.1% Uraniu
m
Base Load 1,146
Total Nuclear 1,146
Steam:
Four Corners 1, 2, 3 3 Coal Base Load 560
Four Corners 4, 5
(
c
)
2 15% Coal Base Load 231
Choll
a
3 Coal Base Load 647
Nava
j
o
(
d
)
3 14% Coal Base Load 315
Ocotillo 2 Gas Peakin
g
220
Saguaro 2 Gas/Oil Peakin
g
210
Total Steam 2,183
Combined C
y
cle:
Redhawk 2 Gas Load Followin
g
984
West Phoenix 5 Gas Load Followin
g
887
Total Combined Cycle 1,871
Combustion Turbine:
Ocotillo 2 Gas Peakin
g
110
Sa
g
uaro 1, 2 2 Gas/Oil Peakin
g
110
Sa
g
uaro 3 1 Gas Peakin
g
79
Dou
g
las 1 Oil Peakin
g
16
Sundance 10 Gas Peakin
g
420
West Phoenix 2 Gas Peakin
g
110
Yucca 1, 2, 3 3 Gas/Oil Peakin
g
93
Yucca 4 1 Oil Peakin
g
54
Yucca 5, 6 2 Gas Peakin
g
96
Total Combustion
Turbine
1,088
Solar:
Cotton Cente
r
1 Sola
r
As Available 17
H
y
der 1 Sola
r
As Available 16
Paloma 1 Sola
r
As Available 17
Multiple facilities Sola
r
As Available 5
Total Solar 55
Total Capacity 6,343
(a) 100% unless otherwise noted.
(b) See “Business of Arizona Public Service Company – Energy Sources and Resource
Planning – Generation Facilities – Nuclear” in Item 1 for details regarding leased interests
in Palo Verde. The other participants are Salt River Project (17.49%), SCE (15.8%), El
Paso Electric Company (15.8%), Public Service Company of New Mexico (10.2%),